Cumulus Networks Case Study

Cumulus Networks published a new case study about my work with them on my recent datacenter network rebuild using Cumulus Linux on Dell Open Networking switches and about how we have used Cumulus NetQ as fabric validation system.

Have a look and read the case study here:

Link: https://cumulusnetworks.com/customers/smartgames-technologies/

Cumulus also published a press release a few weeks ago with one of my quotes about NetQ I made when we were working on the case study.

“With NetQ, we can run small check commands and see what really is going on in our network,” said Bernd Malmqvist, Tech Lead Systems Operations at SmartGames Technologies. “The benefits to us are early alerting and validating the entire state of the fabric. Monitoring is one thing, but with NetQ, the knowledge is instant. NetQ is really unique; it’s a tool that tells us exactly what is wrong in our environment, and the insight to know where an issue is stemming from.”

You can read the full press release read here:

https://cumulusnetworks.com/about/press-releases/cumulus-networks-bolsters-cumulus-netq-kubernetes-integration-provide-network-operators-actionable-insight-container-networking/

Internet Edge and WAN Routing with Cumulus Linux

With this article I wanted to focus on something different than the usual spine and leaf topology and talk about datacenter edge routing.

I was using Cisco routers for many years for Internet Edge and WAN connectivity. The problem with using a vendor like Cisco is the price tag you have to pay and there still might a reason for it to spend the money. But nowadays you get leased-lines handed over as normal Ethernet connection and using a dedicated routers maybe not always necessary if you are not getting too crazy with BGP routing or quality of service.

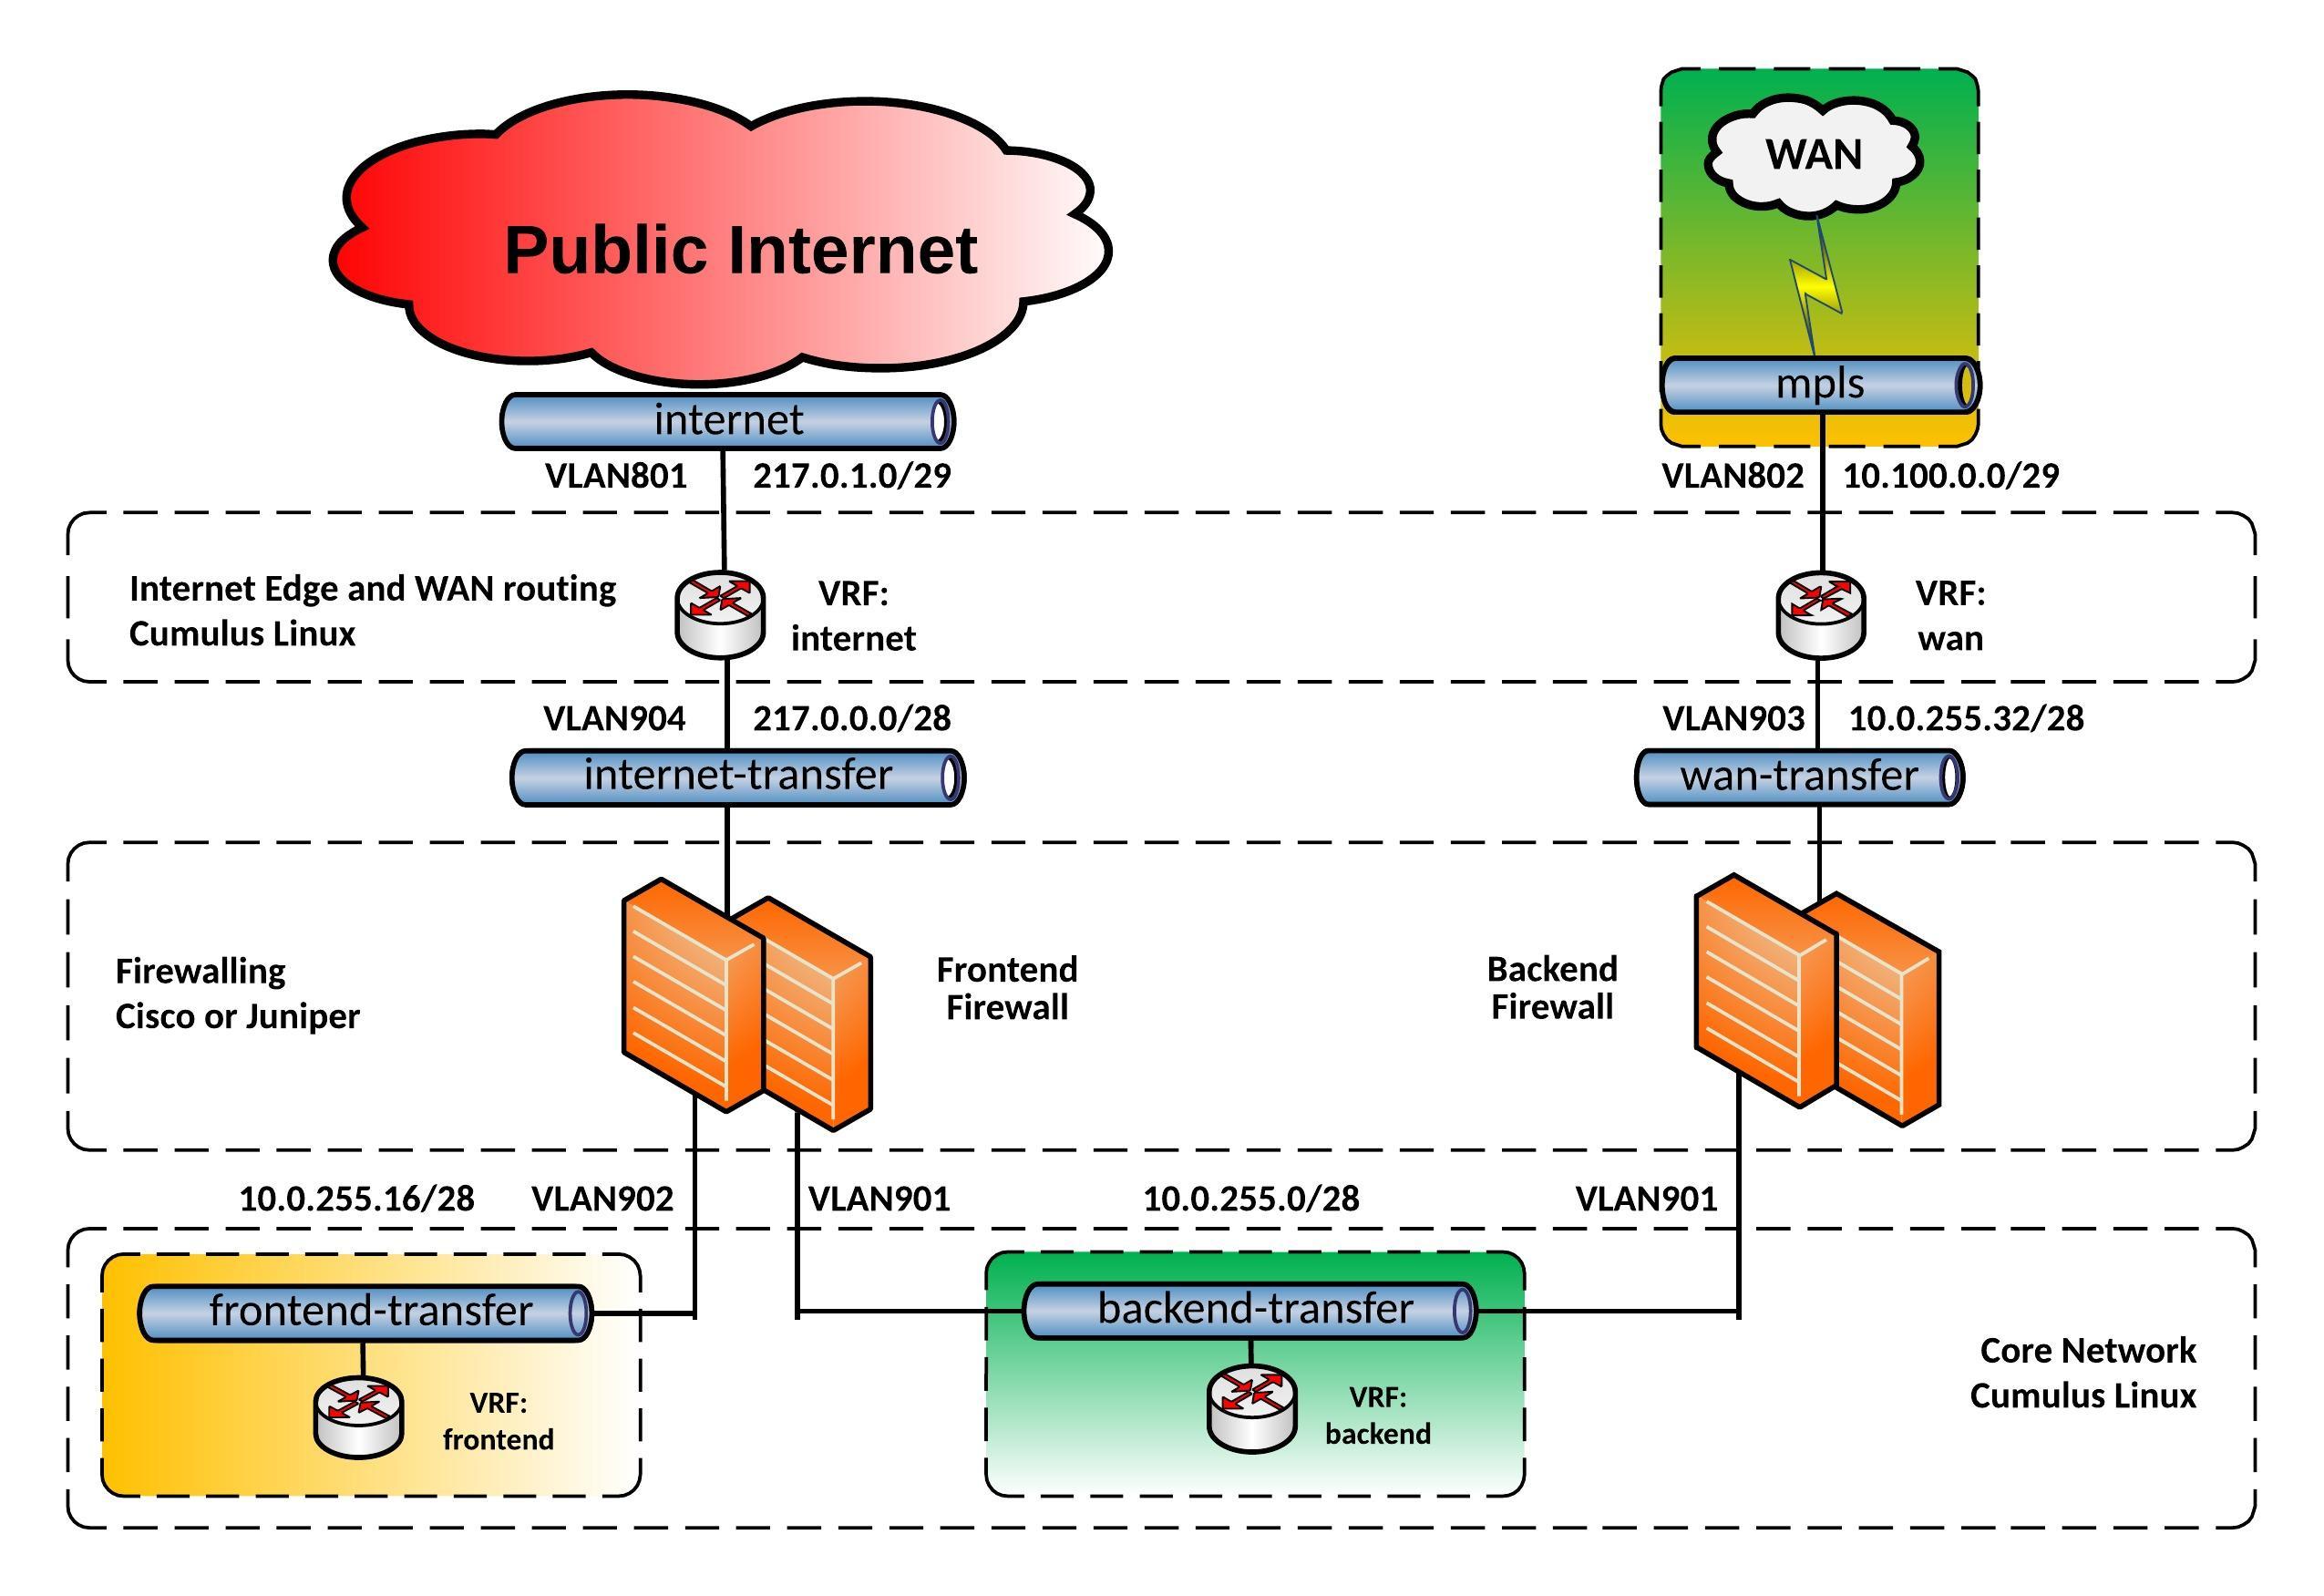
I was experimenting over the last weeks if I could use a Cumulus Linux switch as an Internet Edge and Wide Area Network router with running different VRFs for internet and WAN connectivity. I came up with the following edge network layout you see below:

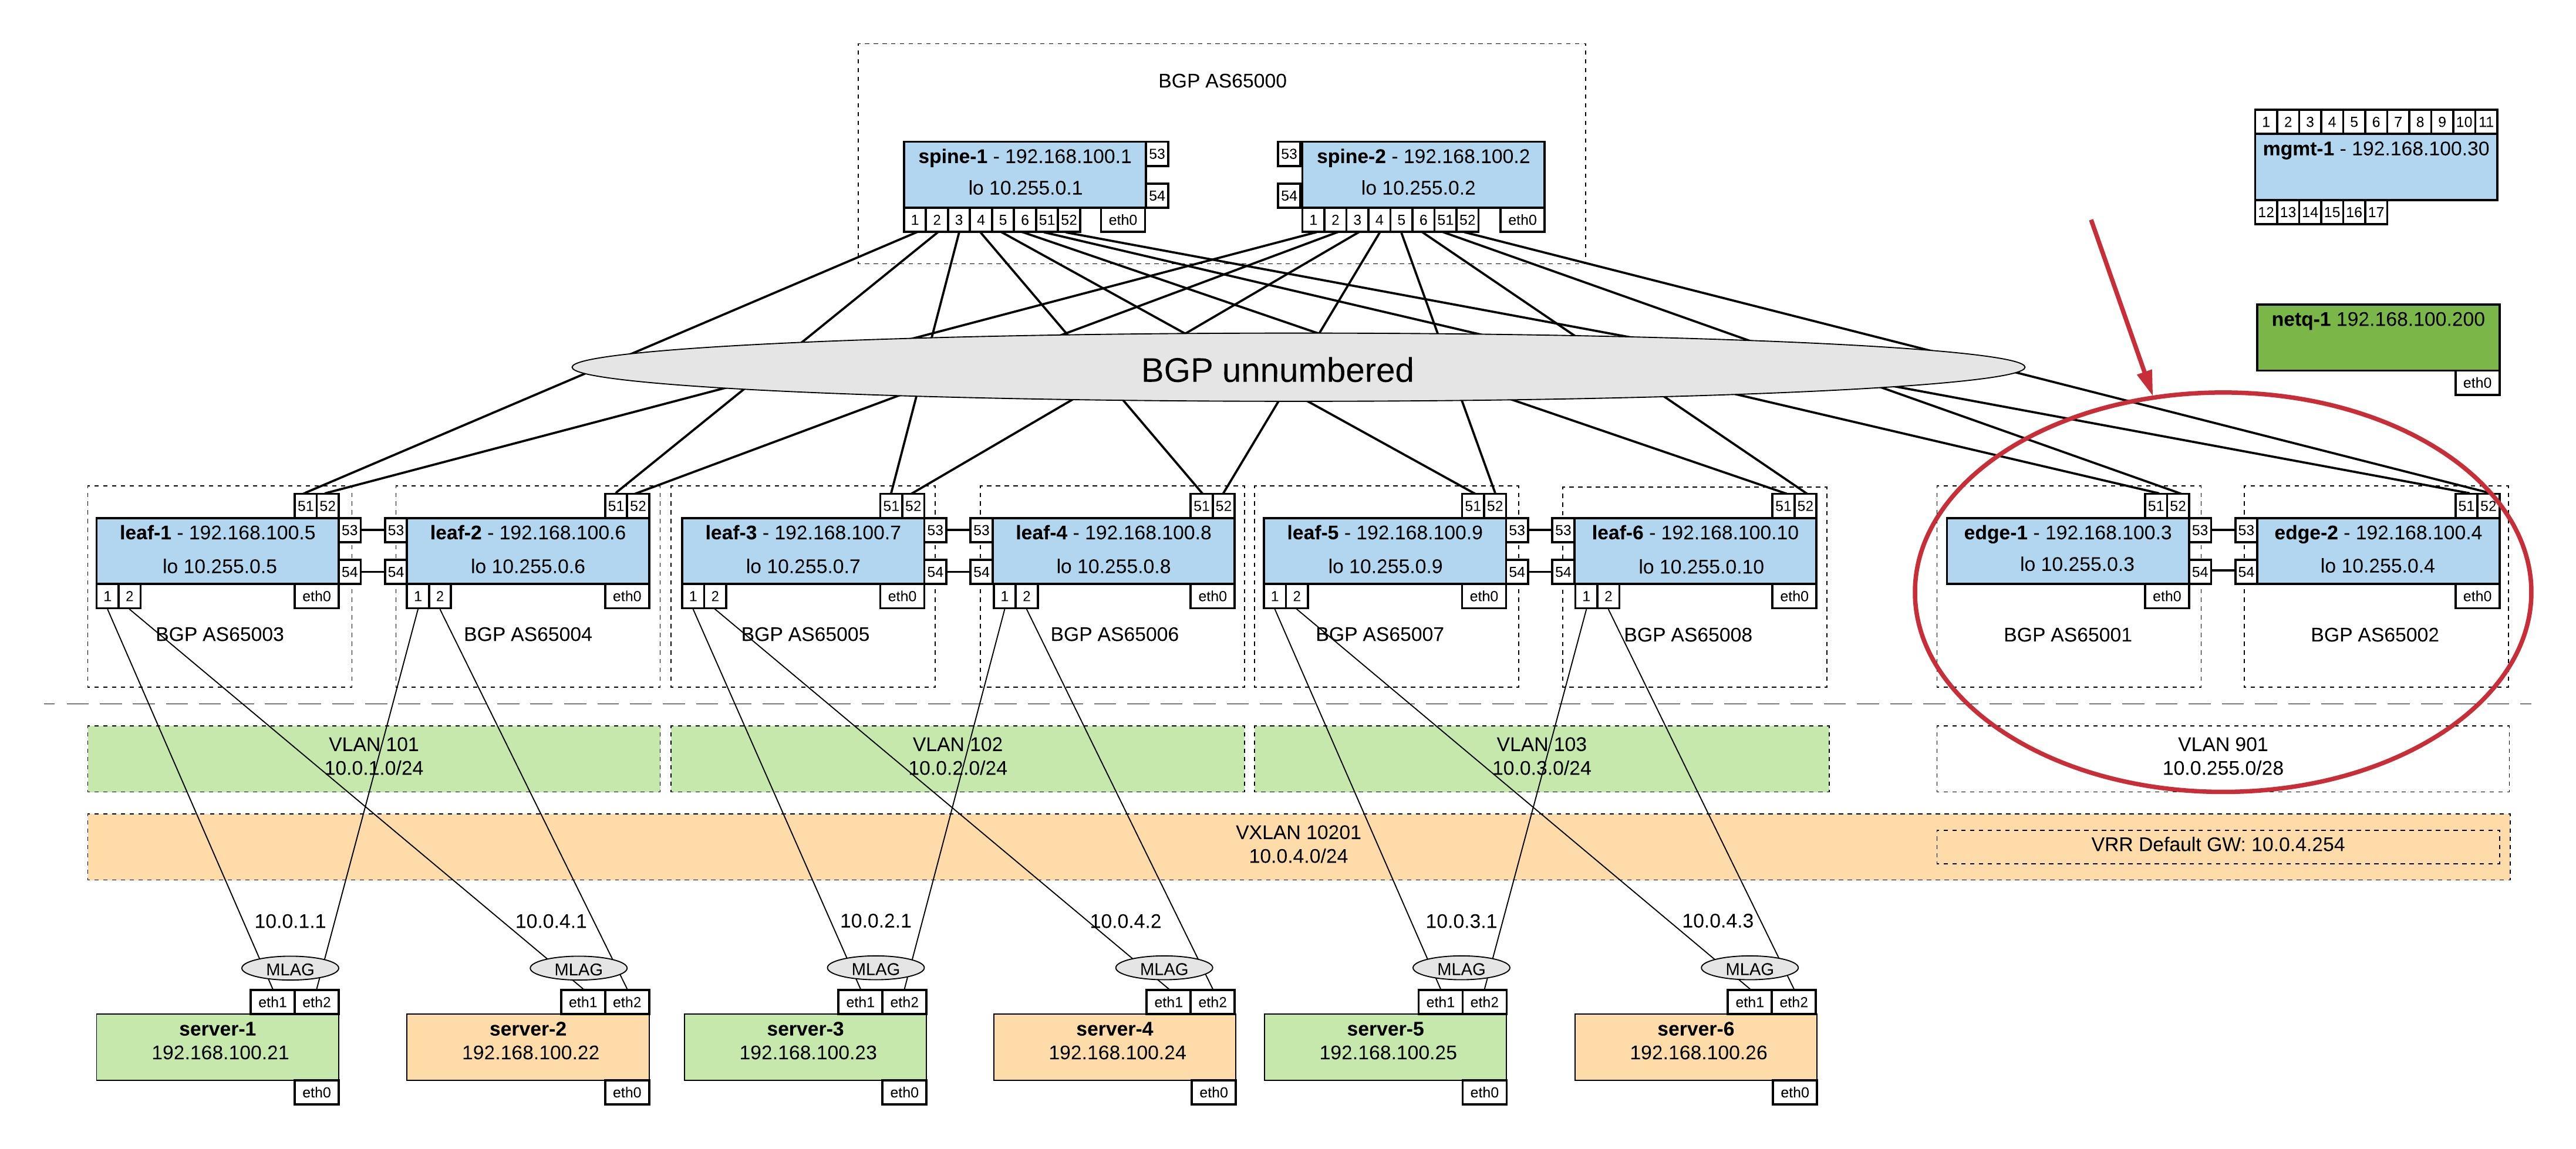
For this network, I build an Vagrant topology with Cumulus VX to simulate the edge routing and being able to test the connectivity. Below you see a more detailed view of the Vagrant topology:

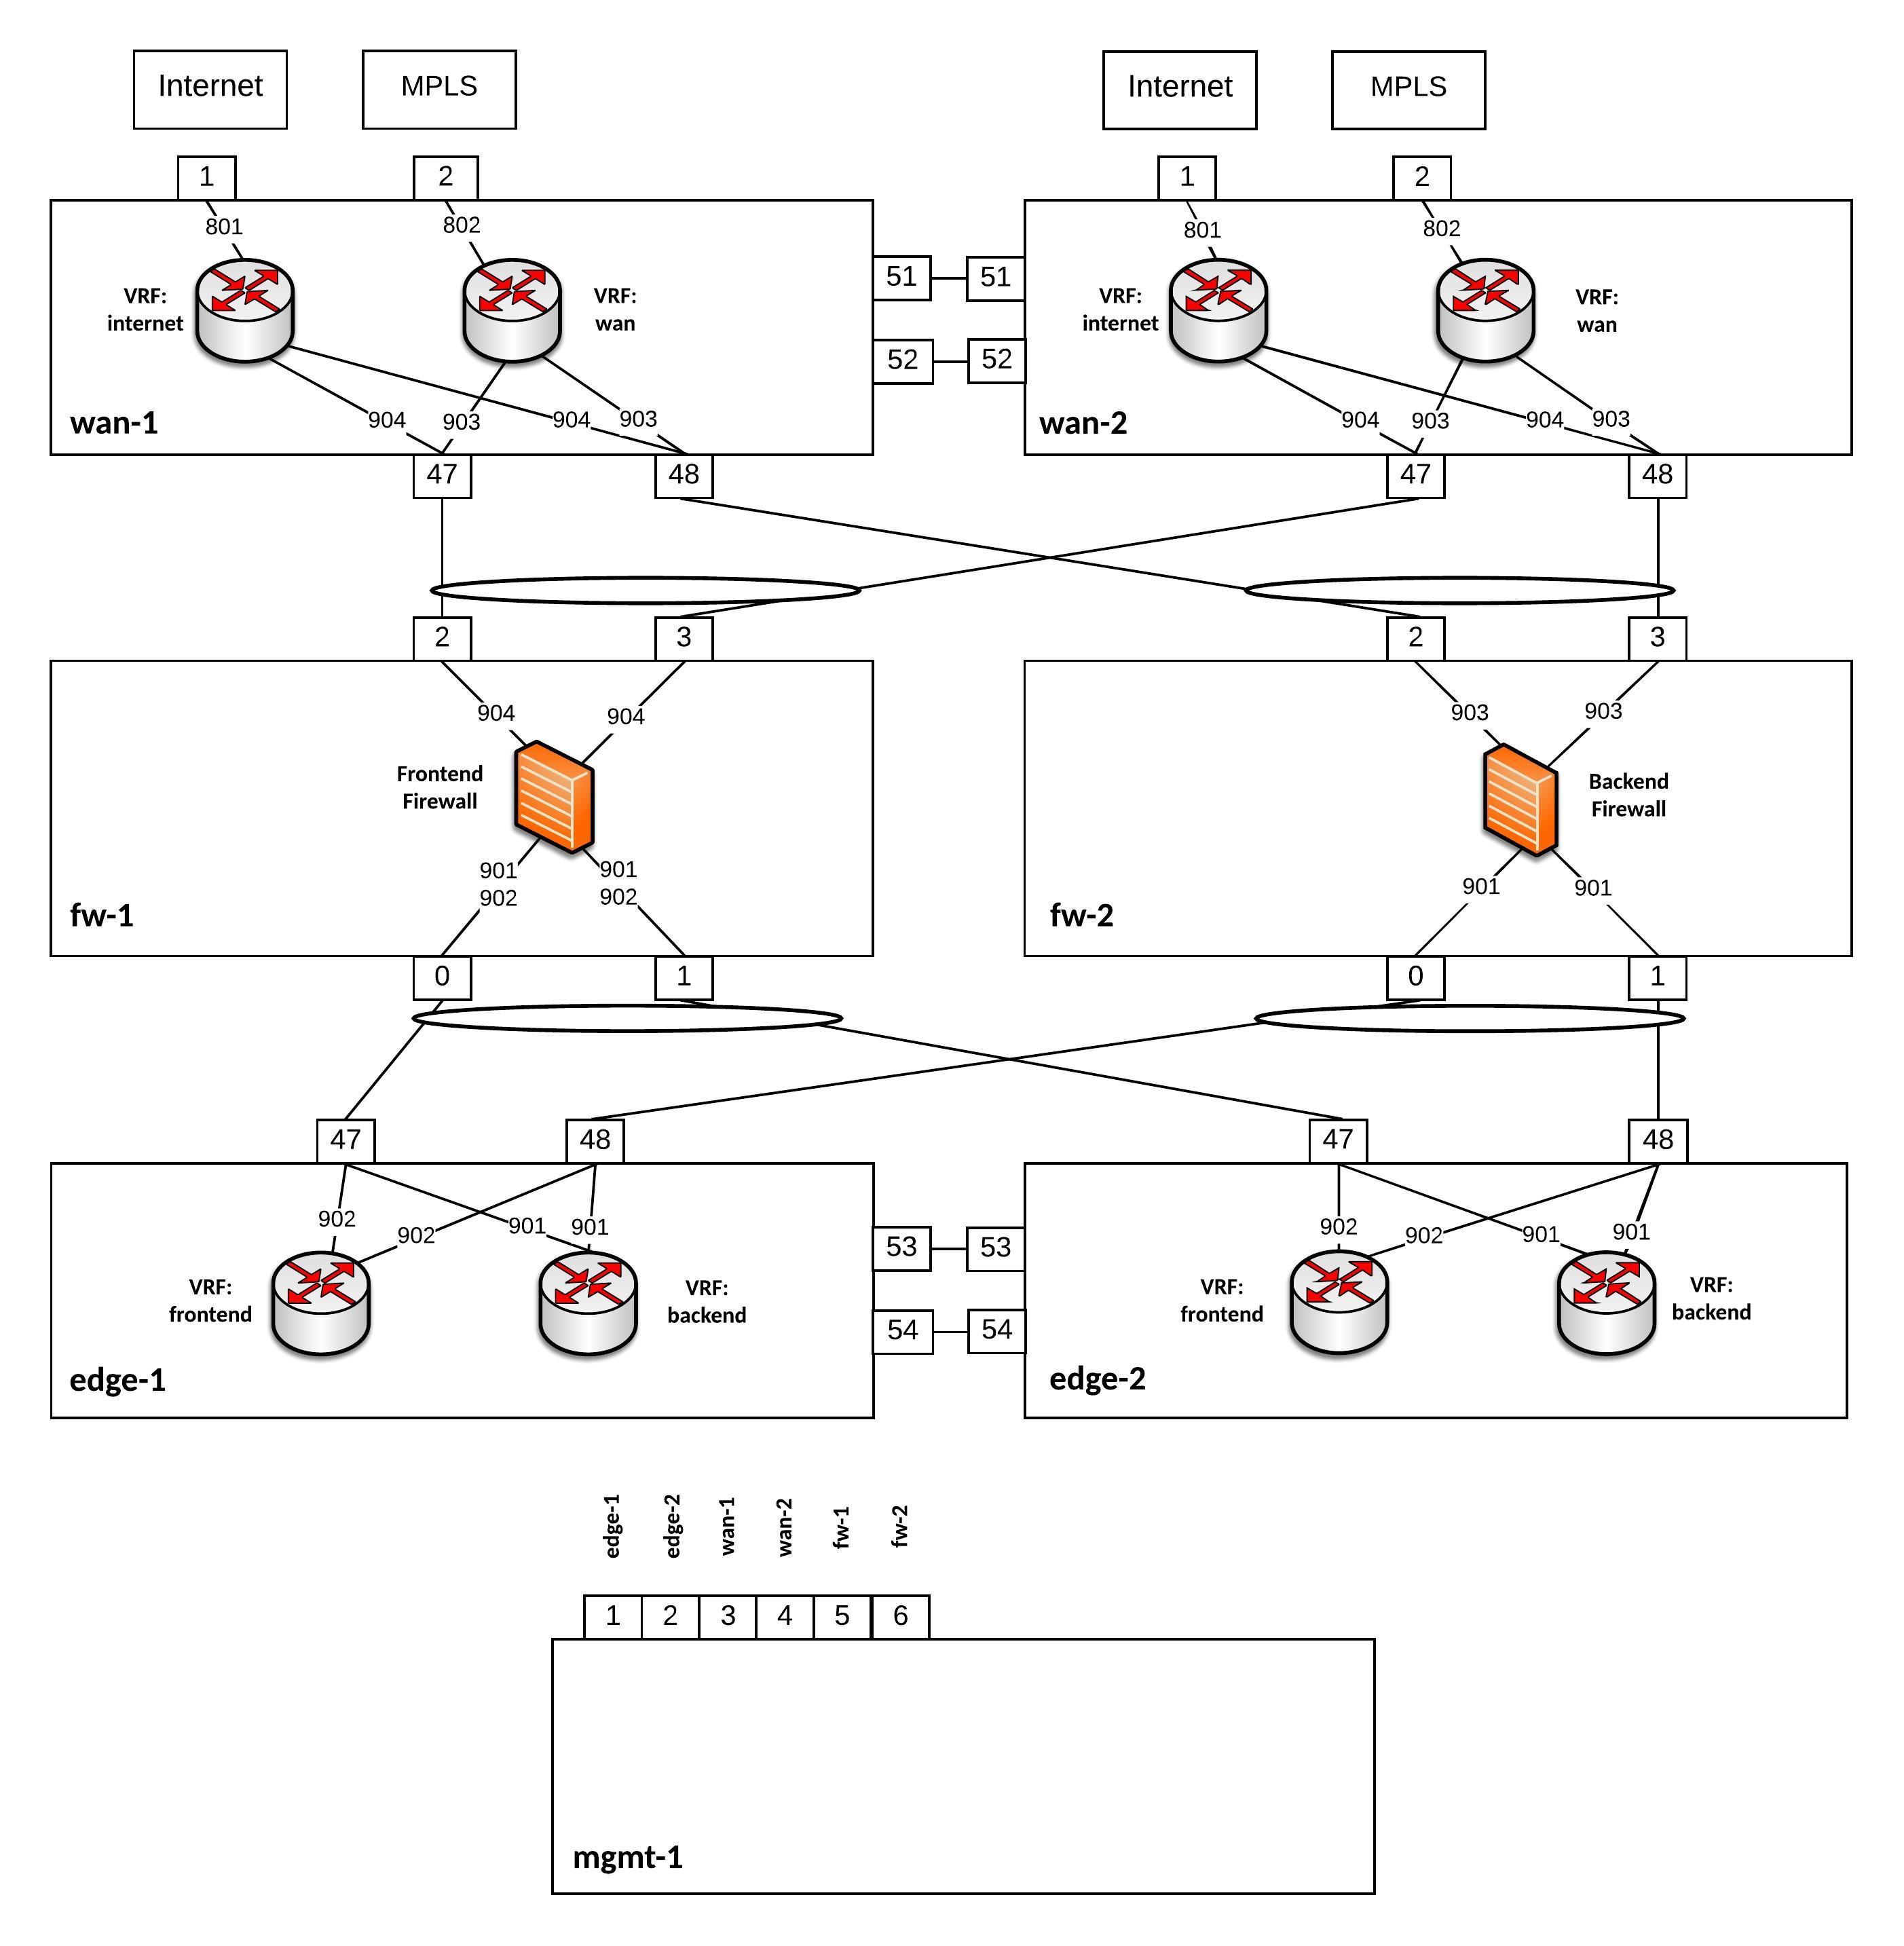
Everything is running on Cumulus VX even the firewalls because I just wanted to simulate the traffic flow and see if the network communication is functioning. Also having separate WAN switches might be useful because 1Gbit/s switches are cheaper then 40Gbit/s switches and you need additional SFP for 1Gbit/s connections, another point is to separate your layer 2 WAN connectivity from your internal datacenter network.

Here the assigned IP addresses for this lab:

wan-1 VLAN801 PIP: 217.0.1.2/29 VIP: 217.0.1.1/29
wan-2 VLAN801 PIP: 217.0.1.3/29 VIP: 217.0.1.1/29
wan-1 VLAN802 PIP: 10.100.0.1/29 
wan-2 VLAN802 PIP: 10.100.0.2/29
wan-1 VLAN904 PIP: 217.0.0.2/28 VIP: 217.0.0.1/28
wan-2 VLAN904 PIP: 217.0.0.3/28 VIP: 217.0.0.1/28
fw-1 VLAN904 PIP: 217.0.0.14/28
wan-1 VLAN903 PIP: 10.0.255.34/28 VIP: 10.0.255.33/28
wan-2 VLAN903 PIP: 10.0.255.35/28 VIP: 10.0.255.33/28
fw-2 VLAN903 PIP: 10.0.255.46/28
edge-1 VLAN901 PIP: 10.0.255.2/28 VIP: 10.0.255.1/28
edge-2 VLAN901 PIP: 10.0.255.3/28 VIP: 10.0.255.1/28
fw-1 VLAN901 PIP: 10.0.255.14/28
fw-2 VLAN901 PIP: 10.0.255.12/28
edge-1 VLAN902 PIP: 10.0.255.18/28 VIP: 10.0.255.17/28
edge-2 VLAN902 PIP: 10.0.255.19/28 VIP: 10.0.255.17/28
fw-1 VLAN902 PIP: 10.0.255.30/28

You can find the Github repository for the Vagrant topology here: https://github.com/berndonline/cumulus-edge-vagrant

berndonline@lab:~/cumulus-edge-vagrant$ vagrant status
Current machine states:

fw-2                      running (libvirt)
fw-1                      running (libvirt)
mgmt-1                    running (libvirt)
edge-2                    running (libvirt)
edge-1                    running (libvirt)
wan-1                     running (libvirt)
wan-2                     running (libvirt)

This environment represents multiple VMs. The VMs are all listed
above with their current state. For more information about a specific
VM, run `vagrant status NAME`.
berndonline@lab:~/cumulus-edge-vagrant$

I wrote as well an Ansible Playbook to deploy the initial configuration which you can find here: https://github.com/berndonline/cumulus-edge-provision

Let’s execute the playbook:

berndonline@lab:~/cumulus-edge-vagrant$ ansible-playbook ../cumulus-edge-provision/site.yml

PLAY [edge] ********************************************************************************************************************************************************

TASK [switchgroups : create switch groups based on clag_pairs] *****************************************************************************************************
skipping: [edge-2] => (item=(u'wan', [u'wan-1', u'wan-2']))
skipping: [edge-1] => (item=(u'wan', [u'wan-1', u'wan-2']))
ok: [edge-2] => (item=(u'edge', [u'edge-1', u'edge-2']))
ok: [wan-1] => (item=(u'wan', [u'wan-1', u'wan-2']))
skipping: [wan-1] => (item=(u'edge', [u'edge-1', u'edge-2']))
ok: [edge-1] => (item=(u'edge', [u'edge-1', u'edge-2']))
ok: [wan-2] => (item=(u'wan', [u'wan-1', u'wan-2']))
skipping: [wan-2] => (item=(u'edge', [u'edge-1', u'edge-2']))

TASK [switchgroups : include switch group variables] ***************************************************************************************************************
skipping: [edge-2] => (item=(u'wan', [u'wan-1', u'wan-2']))
skipping: [edge-1] => (item=(u'wan', [u'wan-1', u'wan-2']))
ok: [wan-1] => (item=(u'wan', [u'wan-1', u'wan-2']))
skipping: [wan-1] => (item=(u'edge', [u'edge-1', u'edge-2']))
ok: [wan-2] => (item=(u'wan', [u'wan-1', u'wan-2']))
skipping: [wan-2] => (item=(u'edge', [u'edge-1', u'edge-2']))
ok: [edge-2] => (item=(u'edge', [u'edge-1', u'edge-2']))
ok: [edge-1] => (item=(u'edge', [u'edge-1', u'edge-2']))

...

RUNNING HANDLER [interfaces : reload networking] *******************************************************************************************************************
changed: [edge-2] => (item=ifreload -a)
changed: [edge-1] => (item=ifreload -a)
changed: [wan-1] => (item=ifreload -a)
changed: [wan-2] => (item=ifreload -a)
changed: [edge-2] => (item=sleep 10)
changed: [edge-1] => (item=sleep 10)
changed: [wan-2] => (item=sleep 10)
changed: [wan-1] => (item=sleep 10)

RUNNING HANDLER [routing : reload frr] *****************************************************************************************************************************
changed: [edge-2]
changed: [wan-1]
changed: [wan-2]
changed: [edge-1]

RUNNING HANDLER [ptm : restart ptmd] *******************************************************************************************************************************
changed: [edge-2]
changed: [edge-1]
changed: [wan-2]
changed: [wan-1]

RUNNING HANDLER [ntp : restart ntp] ********************************************************************************************************************************
changed: [wan-1]
changed: [edge-1]
changed: [wan-2]
changed: [edge-2]

RUNNING HANDLER [ifplugd : restart ifplugd] ************************************************************************************************************************
changed: [edge-1]
changed: [wan-1]
changed: [edge-2]
changed: [wan-2]

PLAY RECAP *********************************************************************************************************************************************************
edge-1                     : ok=21   changed=17   unreachable=0    failed=0
edge-2                     : ok=21   changed=17   unreachable=0    failed=0
wan-1                      : ok=21   changed=17   unreachable=0    failed=0
wan-2                      : ok=21   changed=17   unreachable=0    failed=0

berndonline@lab:~/cumulus-edge-vagrant$

At last but not least I wrote a simple Ansible Playbook for connectivity testing using ping what you can find here: https://github.com/berndonline/cumulus-edge-provision/blob/master/icmp_check.yml

berndonline@lab:~/cumulus-edge-vagrant$ ansible-playbook ../cumulus-edge-provision/check_icmp.yml

PLAY [exit edge] *********************************************************************************************************************************************************************************************************************

TASK [connectivity check from frontend firewall] *************************************************************************************************************************************************************************************
skipping: [fw-2] => (item=10.0.255.33)
skipping: [fw-2] => (item=10.0.255.17)
skipping: [fw-2] => (item=10.0.255.1)
skipping: [fw-2] => (item=217.0.0.1)
skipping: [edge-2] => (item=10.0.255.33)
skipping: [edge-2] => (item=10.0.255.17)
skipping: [edge-2] => (item=10.0.255.1)
skipping: [edge-1] => (item=10.0.255.33)
skipping: [edge-2] => (item=217.0.0.1)
skipping: [edge-1] => (item=10.0.255.17)
skipping: [edge-1] => (item=10.0.255.1)
skipping: [wan-1] => (item=10.0.255.33)
skipping: [edge-1] => (item=217.0.0.1)
skipping: [wan-1] => (item=10.0.255.17)
skipping: [wan-1] => (item=10.0.255.1)
skipping: [wan-1] => (item=217.0.0.1)
skipping: [wan-2] => (item=10.0.255.33)
skipping: [wan-2] => (item=10.0.255.17)
skipping: [wan-2] => (item=10.0.255.1)
skipping: [wan-2] => (item=217.0.0.1)
changed: [fw-1] => (item=10.0.255.33)
changed: [fw-1] => (item=10.0.255.17)
changed: [fw-1] => (item=10.0.255.1)
changed: [fw-1] => (item=217.0.0.1)
...
PLAY RECAP ***************************************************************************************************************************************************************************************************************************
edge-1                     : ok=2    changed=2    unreachable=0    failed=0
edge-2                     : ok=2    changed=2    unreachable=0    failed=0
fw-1                       : ok=1    changed=1    unreachable=0    failed=0
fw-2                       : ok=1    changed=1    unreachable=0    failed=0
wan-1                      : ok=2    changed=2    unreachable=0    failed=0
wan-2                      : ok=2    changed=2    unreachable=0    failed=0

berndonline@lab:~/cumulus-edge-vagrant$

The icmp check shows that in general the edge routing is working but I need to do some further testing with this if this can be used in a production environment.

If using switch hardware is not the right fit you can still install and use Free Range Routing (FRR) from Cumulus Networks on other Linux distributions and pick server hardware for your own custom edge router. I would only recommend checking Linux kernel support for VRF when choosing another Linux OS. Also have a look at my article about Open Source Routing GRE over IPSec with StrongSwan and Cisco IOS-XE where I build a Debian software router.

Please share your feedback and leave a comment.

Network Monitoring with Prometheus and Cumulus Linux

As promised in my previous article Install Prometheus and Grafana, this post is about how to monitor Cumulus Linux switches with Prometheus.

Let’s start directly by installing the Prometheus Node_Exporter:

sudo useradd --no-create-home --shell /bin/false node_exporter

tar xvf node_exporter-0.15.1.linux-amd64.tar.gz
sudo cp node_exporter-0.15.1.linux-amd64/node_exporter /usr/local/bin
sudo chown node_exporter:node_exporter /usr/local/bin/node_exporter

sudo bash -c 'cat << EOF > /etc/systemd/system/node_exporter.service
[Unit]
Description=Node Exporter
Wants=network-online.target
After=network-online.target

[Service]
User=node_exporter
Group=node_exporter
Type=simple
ExecStart=/usr/local/bin/node_exporter

[Install]
WantedBy=multi-user.target
EOF'

sudo systemctl daemon-reload
sudo systemctl start node_exporter
sudo systemctl status node_exporter

Check that the Node_Exporter service is correctly running and listing on tcp 9100 for the Prometheus server to collect the metrics from the switches:

vagrant@spine-2:~$ sudo systemctl status node_exporter
● node_exporter.service - Node Exporter
   Loaded: loaded (/etc/systemd/system/node_exporter.service; disabled)
   Active: active (running) since Thu 2018-03-22 13:41:26 UTC; 958ms ago
 Main PID: 5620 (node_exporter)
   CGroup: /system.slice/node_exporter.service
           └─5620 /usr/local/bin/node_exporter

Mar 22 13:41:26 spine-2 node_exporter[5620]: time="2018-03-22T13:41:26Z" level=info msg=" - sockstat" source="node_exporter.go:52"
Mar 22 13:41:26 spine-2 node_exporter[5620]: time="2018-03-22T13:41:26Z" level=info msg=" - bcache" source="node_exporter.go:52"
Mar 22 13:41:26 spine-2 node_exporter[5620]: time="2018-03-22T13:41:26Z" level=info msg=" - hwmon" source="node_exporter.go:52"
Mar 22 13:41:26 spine-2 node_exporter[5620]: time="2018-03-22T13:41:26Z" level=info msg=" - cpu" source="node_exporter.go:52"
Mar 22 13:41:26 spine-2 node_exporter[5620]: time="2018-03-22T13:41:26Z" level=info msg=" - stat" source="node_exporter.go:52"
Mar 22 13:41:26 spine-2 node_exporter[5620]: time="2018-03-22T13:41:26Z" level=info msg=" - timex" source="node_exporter.go:52"
Mar 22 13:41:26 spine-2 node_exporter[5620]: time="2018-03-22T13:41:26Z" level=info msg=" - textfile" source="node_exporter.go:52"
Mar 22 13:41:26 spine-2 node_exporter[5620]: time="2018-03-22T13:41:26Z" level=info msg=" - conntrack" source="node_exporter.go:52"
Mar 22 13:41:26 spine-2 node_exporter[5620]: time="2018-03-22T13:41:26Z" level=info msg=" - edac" source="node_exporter.go:52"
Mar 22 13:41:26 spine-2 node_exporter[5620]: time="2018-03-22T13:41:26Z" level=info msg="Listening on :9100" source="node_exporter.go:76"
vagrant@spine-2:~$

I created a simple dashboard in Grafana for the switches running Cumulus Linux, where you can find important metrics like throughput of the network interfaces, CPU load, Memory and disk related information:

On the top right corner you can select the switch where you want to see metrics from:

You can also have a central monitoring dashboard where all performance metrics are shown:

Here are detailed views with information about all interfaces from the different switch groups:

This is a very simple solution to monitor your Cumulus Linux switches and in combination with Cumulus NetQ enough to monitor your switch fabric.

FYI, I have used the following virtual topology BGP EVPN and VXLAN with Cumulus Linux.

Please share your feedback and leave a comment.

Getting started with Jenkins for Network Automation

As I have mentioned my previous post about Getting started with Gitlab-CI for Network Automation, Jenkins is another continuous integration pipelining tool you can use for network automation. Have a look about how to install Jenkins: https://wiki.jenkins.io/display/JENKINS/Installing+Jenkins+on+Ubuntu

To use the Jenkins with Vagrant and KVM (libvirt) there are a few changes needed on the linux server similar with the Gitlab-Runner. The Jenkins user account needs to be able to control KVM and you need to install the vagrant-libvirt plugin:

usermod -aG libvirtd jenkins
sudo su jenkins
vagrant plugin install vagrant-libvirt

Optional: you may need to copy custom Vagrant boxes into the users vagrant folder ‘/var/lib/jenkins/.vagrant.d/boxes/*’. Note that the Jenkins home directory is not located under /home.

Now lets start configuring a Jenkins CI-pipeline, click on ‘New item’:

This creates an empty pipeline where you need to add the different stages  of what needs to be executed:

Below is an example Jenkins pipeline script which is very similar to the Gitlab-CI pipeline I have used with my Cumulus Linux Lab in the past.

pipeline {
    agent any
    stages {
        stage('Clean and prep workspace') {
            steps {
                sh 'rm -r *'
                git 'https://github.com/berndonline/cumulus-lab-provision'
                sh 'git clone --origin master https://github.com/berndonline/cumulus-lab-vagrant'
            }
        }
        stage('Validate Ansible') {
            steps {
                sh 'bash ./linter.sh'
            }
        }
        stage('Staging') {
            steps {
                sh 'cd ./cumulus-lab-vagrant/ && ./vagrant_create.sh'
                sh 'cd ./cumulus-lab-vagrant/ && bash ../staging.sh'
            }
        }
        stage('Deploy production approval') {
            steps {
                input 'Deploy to prod?'
            }
        }
        stage('Production') {
            steps {
                sh 'cd ./cumulus-lab-vagrant/ && ./vagrant_create.sh'
                sh 'cd ./cumulus-lab-vagrant/ && bash ../production.sh'
            }
        }
    }
}

Let’s run the build pipeline:

The stages get executed one by one and, as you can see below, the production stage has an manual approval build-in that nothing gets deployed to production without someone to approve before, for a controlled production deployment:

Finished pipeline:

This is just a simple example of a network automation pipeline, this can of course be more complex if needed. It should just help you a bit on how to start using Jenkins for network automation.

Please share your feedback and leave a comment.

Getting started with Gitlab-CI for Network Automation

Ken Murphy from networkautomationblog.com asked me to do a more detailed post about how to setup Gitlab-Runner on your local server to use with Gitlab-CI. I will not get into too much detail about the installation because Gitlab has a very detailed information about it which you can find here: https://docs.gitlab.com/runner/install/linux-repository.html

Once the Gitlab Runner is installed on your server you need to configure and register the runner with your Gitlab repo. If you are interested in information about this, you can find the documentation here: https://docs.gitlab.com/runner/register/ but lets continue with how to register the runner.

In your project go to ‘Settings -> CI / CD’ to find the registration token:

It is important to disable the shared runners:

Now let’s register the gitlab runner:

berndonline@lab ~ # sudo gitlab-runner register
Running in system-mode.

Please enter the gitlab-ci coordinator URL (e.g. https://gitlab.com/):
https://gitlab.com
Please enter the gitlab-ci token for this runner:
xxxxxxxxx
Please enter the gitlab-ci description for this runner:
[lab]:
Please enter the gitlab-ci tags for this runner (comma separated):
lab
Whether to run untagged builds [true/false]:
[false]: true
Whether to lock the Runner to current project [true/false]:
[true]: false
Registering runner... succeeded                     runner=xxxxx
Please enter the executor: docker-ssh, parallels, ssh, virtualbox, kubernetes, docker, shell, docker+machine, docker-ssh+machine:
shell
Runner registered successfully. Feel free to start it, but if it's running already the config should be automatically reloaded!
berndonline@lab ~ #

You will find the main configuration file under /etc/gitlab-runner/config.toml.

When everything goes well the runner is registered and active, and ready to apply the CI pipeline what is defined in the .gitlab-ci.yml.

To use the runner with Vagrant and KVM (libvirt) there are a few changes needed on the linux server itself, first the gitlab-runner user account needs to be able to control KVM, second the vagrant-libvirt plugin needs to be installed:

usermod -aG libvirtd gitlab-runner
sudo su gitlab-runner
vagrant plugin install vagrant-libvirt

Optional: you may need to copy custom Vagrant boxes into the users vagrant folder ‘/home/gitlab-runner/.vagrant.d/boxes/*’.

Here the example from my Cumulus CI-pipeline .gitlab-ci.yml that I have already shared in my other blog post about Continuous Integration and Delivery for Networking with Cumulus Linux:

---
stages:
    - validate ansible
    - staging
    - production
validate:
    stage: validate ansible
    script:
        - bash ./linter.sh
staging:
    before_script:
        - git clone https://github.com/berndonline/cumulus-lab-vagrant.git
        - cd cumulus-lab-vagrant/
        - python ./topology_converter.py ./topology-production.dot
          -p libvirt --ansible-hostfile
    stage: staging
    script:
        - bash ../staging.sh
production:
    before_script:
        - git clone https://github.com/berndonline/cumulus-lab-vagrant.git
        - cd cumulus-lab-vagrant/
        - python ./topology_converter.py ./topology-production.dot
          -p libvirt --ansible-hostfile
    stage: production
    when: manual
    script:
        - bash ../production.sh
    only:
        - master

The next step is the staging.sh shell script which boots up the vagrant instances and executes the Ansible playbooks. It is better to use a script and report the exit state so that if something goes wrong the Vagrant instances are correctly destroyed.

#!/bin/bash

EXIT=0
vagrant up mgmt-1 --color <<< 'mgmt-1 boot' || EXIT=$?
vagrant up netq-1 --color <<< 'netq-1 boot' || EXIT=$?
sleep 300
vagrant up spine-1 --color <<< 'spine-1 boot' || EXIT=$?
vagrant up spine-2 --color <<< 'spine-2 boot' || EXIT=$?
sleep 60
vagrant up edge-1 --color <<< 'edge-1 boot' || EXIT=$?
vagrant up edge-2 --color <<< 'edge-2 boot' || EXIT=$?
sleep 60
vagrant up leaf-1 --color <<< 'leaf-1 boot' || EXIT=$?
vagrant up leaf-2 --color <<< 'leaf-2 boot' || EXIT=$?
vagrant up leaf-3 --color <<< 'leaf-3 boot' || EXIT=$?
vagrant up leaf-4 --color <<< 'leaf-4 boot' || EXIT=$?
vagrant up leaf-5 --color <<< 'leaf-5 boot' || EXIT=$?
vagrant up leaf-6 --color <<< 'leaf-6 boot' || EXIT=$?
sleep 60
vagrant up server-1 --color <<< 'server-1 boot' || EXIT=$?
vagrant up server-2 --color <<< 'server-2 boot' || EXIT=$?
vagrant up server-3 --color <<< 'server-3 boot' || EXIT=$?
vagrant up server-4 --color <<< 'server-4 boot' || EXIT=$?
vagrant up server-5 --color <<< 'server-5 boot' || EXIT=$?
vagrant up server-6 --color <<< 'server-6 boot' || EXIT=$?
sleep 60
export ANSIBLE_FORCE_COLOR=true
ansible-playbook ./helper_scripts/configure_servers.yml <<< 'ansible playbook' || EXIT=$?
ansible-playbook ../site.yml <<< 'ansible playbook' || EXIT=$?
sleep 60
ansible-playbook ../icmp_check.yml <<< 'icmp check' || EXIT=$?
vagrant destroy -f
echo $EXIT
exit $EXIT

Basically any change in the repository triggers the .gitlab-ci.yml and executes the pipeline; starting with the stage validating the Ansible syntax:

Continue with staging the configuration and deploying to production. The production stage is a manual trigger to have a controlled deployment:

In one of my next posts I will explain how to use Jenkins instead of Gitlab-CI for Network Automation. Jenkins is very similar to the runner but more flexible with what you can do with it.

Leave a comment