As promised in my previous article Install Prometheus and Grafana, this post is about how to monitor Cumulus Linux switches with Prometheus.
Let’s start directly by installing the Prometheus Node_Exporter:
sudo useradd --no-create-home --shell /bin/false node_exporter

tar xvf node_exporter-0.15.1.linux-amd64.tar.gz
sudo cp node_exporter-0.15.1.linux-amd64/node_exporter /usr/local/bin
sudo chown node_exporter:node_exporter /usr/local/bin/node_exporter

sudo bash -c 'cat << EOF > /etc/systemd/system/node_exporter.service
[Unit]
Description=Node Exporter
Wants=network-online.target
After=network-online.target

[Service]
User=node_exporter
Group=node_exporter
Type=simple
ExecStart=/usr/local/bin/node_exporter

[Install]
WantedBy=multi-user.target
EOF'

sudo systemctl daemon-reload
sudo systemctl start node_exporter
sudo systemctl status node_exporter
Check that the Node_Exporter service is correctly running and listing on tcp 9100 for the Prometheus server to collect the metrics from the switches:
vagrant@spine-2:~$ sudo systemctl status node_exporter
● node_exporter.service - Node Exporter
   Loaded: loaded (/etc/systemd/system/node_exporter.service; disabled)
   Active: active (running) since Thu 2018-03-22 13:41:26 UTC; 958ms ago
 Main PID: 5620 (node_exporter)
   CGroup: /system.slice/node_exporter.service
           └─5620 /usr/local/bin/node_exporter

Mar 22 13:41:26 spine-2 node_exporter[5620]: time="2018-03-22T13:41:26Z" level=info msg=" - sockstat" source="node_exporter.go:52"
Mar 22 13:41:26 spine-2 node_exporter[5620]: time="2018-03-22T13:41:26Z" level=info msg=" - bcache" source="node_exporter.go:52"
Mar 22 13:41:26 spine-2 node_exporter[5620]: time="2018-03-22T13:41:26Z" level=info msg=" - hwmon" source="node_exporter.go:52"
Mar 22 13:41:26 spine-2 node_exporter[5620]: time="2018-03-22T13:41:26Z" level=info msg=" - cpu" source="node_exporter.go:52"
Mar 22 13:41:26 spine-2 node_exporter[5620]: time="2018-03-22T13:41:26Z" level=info msg=" - stat" source="node_exporter.go:52"
Mar 22 13:41:26 spine-2 node_exporter[5620]: time="2018-03-22T13:41:26Z" level=info msg=" - timex" source="node_exporter.go:52"
Mar 22 13:41:26 spine-2 node_exporter[5620]: time="2018-03-22T13:41:26Z" level=info msg=" - textfile" source="node_exporter.go:52"
Mar 22 13:41:26 spine-2 node_exporter[5620]: time="2018-03-22T13:41:26Z" level=info msg=" - conntrack" source="node_exporter.go:52"
Mar 22 13:41:26 spine-2 node_exporter[5620]: time="2018-03-22T13:41:26Z" level=info msg=" - edac" source="node_exporter.go:52"
Mar 22 13:41:26 spine-2 node_exporter[5620]: time="2018-03-22T13:41:26Z" level=info msg="Listening on :9100" source="node_exporter.go:76"
vagrant@spine-2:~$
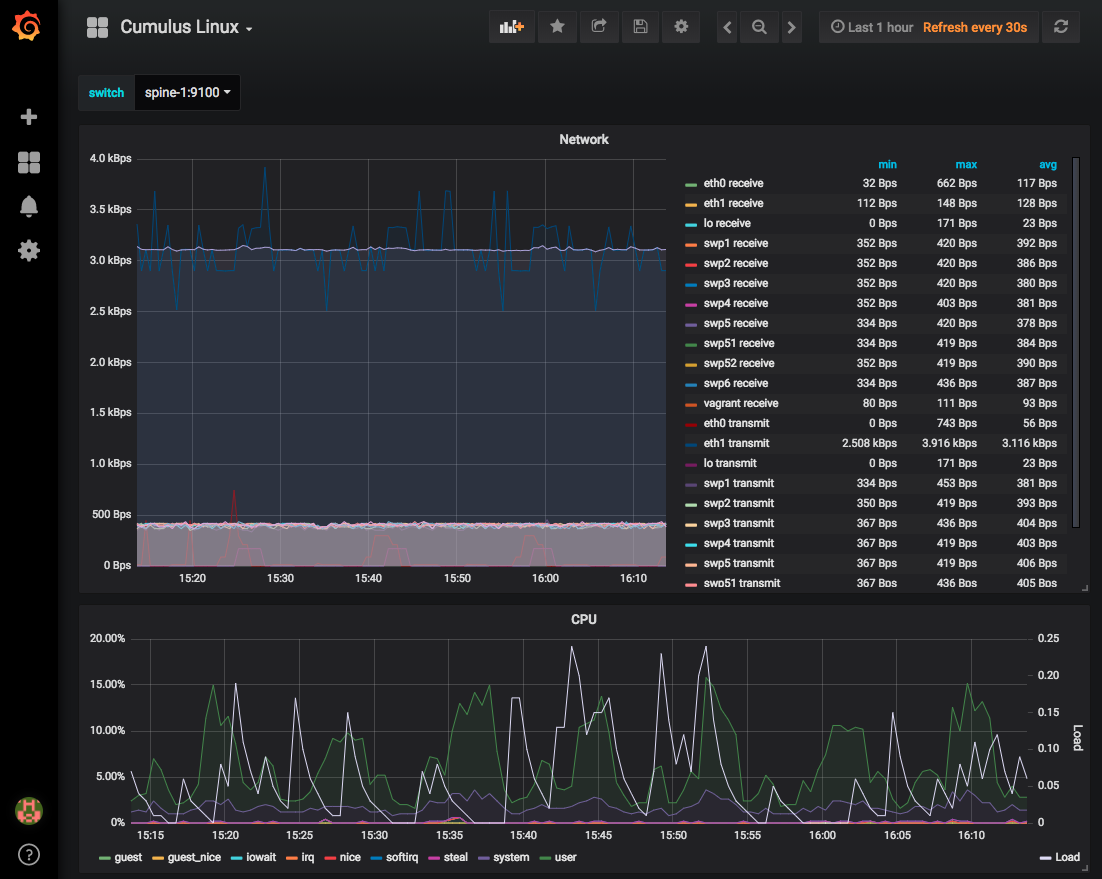
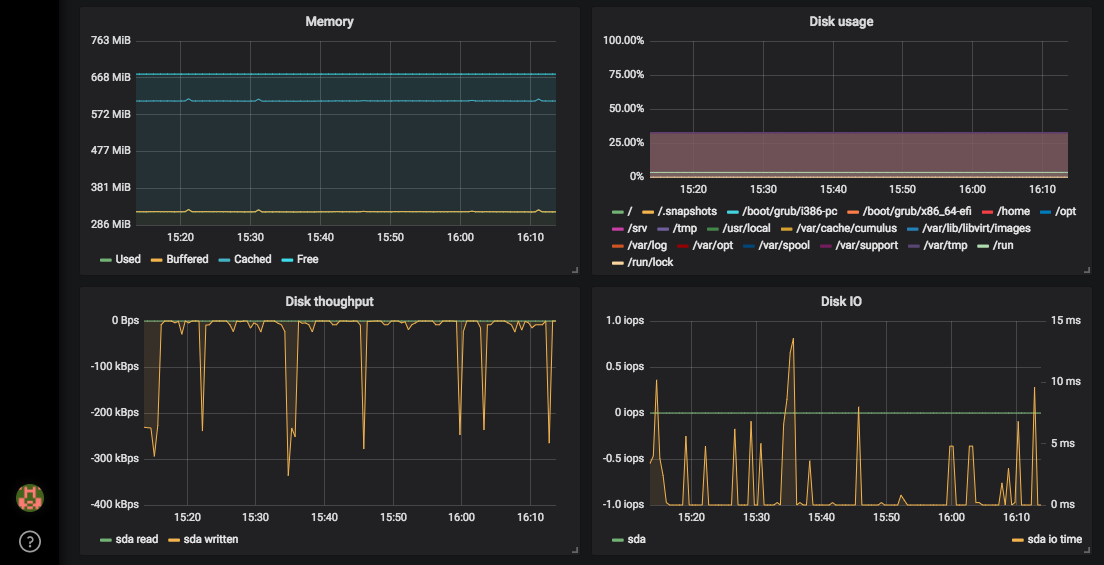
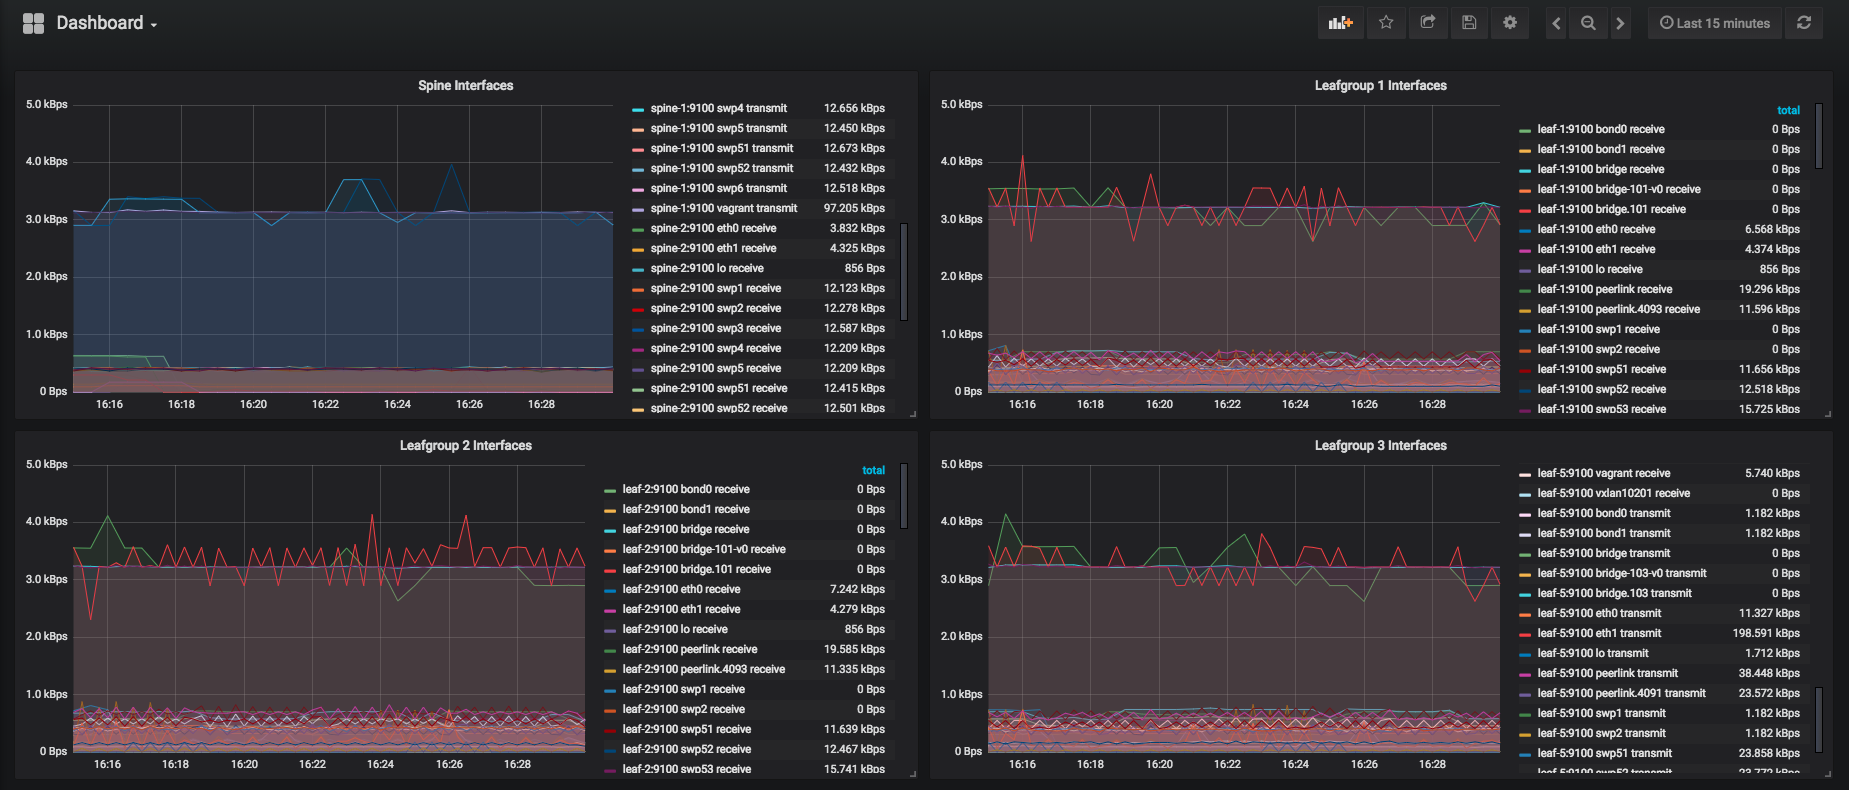
I created a simple dashboard in Grafana for the switches running Cumulus Linux, where you can find important metrics like throughput of the network interfaces, CPU load, Memory and disk related information:
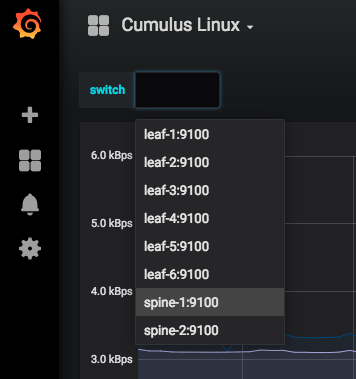
On the top right corner you can select the switch where you want to see metrics from:
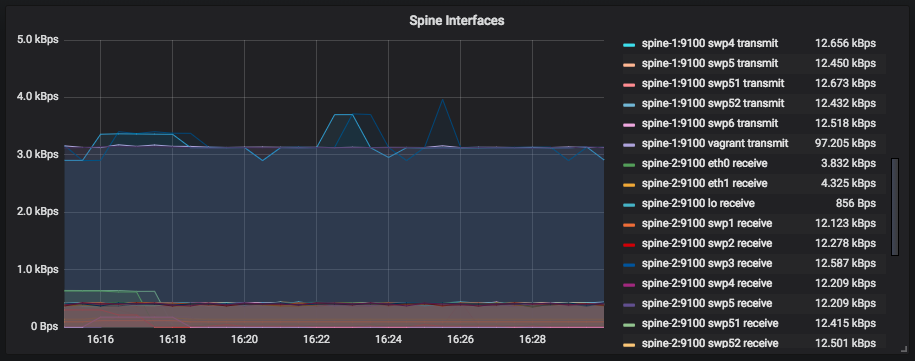
You can also have a central monitoring dashboard where all performance metrics are shown:
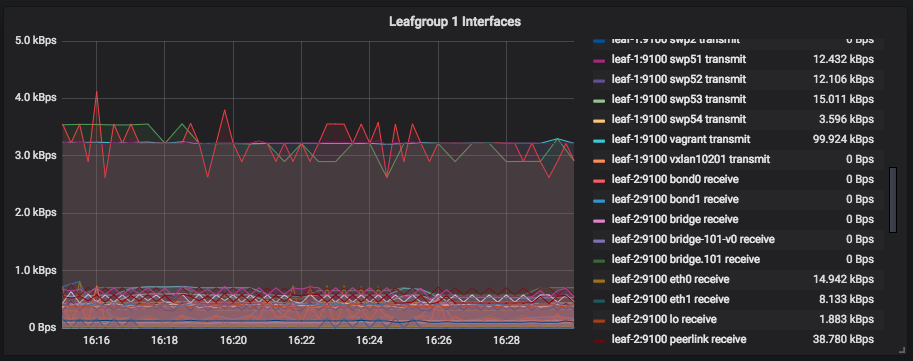
Here are detailed views with information about all interfaces from the different switch groups:
This is a very simple solution to monitor your Cumulus Linux switches and in combination with Cumulus NetQ enough to monitor your switch fabric.
FYI, I have used the following virtual topology BGP EVPN and VXLAN with Cumulus Linux.
Please share your feedback and leave a comment.
Great work! Any chance of sharing the dashboards?
Hi Travis,
Will export the dashboard over the weekend and share the Json file with you.
Best,
Bernd
Bernd, how about a git repo so we can all have a look? 🙂
Hi Nicola,
Unfortunately I re-installed my lab server and lost the Grafana dashboard for the Cumulus switches, and didn’t backup my work before. 🙁
When I have some time I will re-create everything but I am testing SysDig monitoring at the moment.
-Bernd