On the first look OpenShift/Kubernetes seems like a very complex platform but once you start to get to know the different components and what they are doing, you will see it gets easier and easier. The purpose of this article to give you an every day guide based on my experience on how to successfully troubleshoot issues on OpenShift.
- OpenShift service logging
# OpenShift 3.1 to OpenShift 3.9:
/etc/sysconfig/atomic-openshift-master-controllers
/etc/sysconfig/atomic-openshift-master-api
/etc/sysconfig/atomic-openshift-node

# OpenShift 3.10 and later versions:
/etc/origin/master/master.env # for API and Controllers
/etc/sysconfig/atomic-openshift-node
The log levels for the OpenShift services can be controlled via the –loglevel parameter in the service options.
0 – Errors and warnings only
2 – Normal information
4 – Debugging information
6 – API- debugging information (request / response)
8 – Body API debugging information
For example add or edit the line in /etc/sysconfig/atomic-openshift-node to OPTIONS=’–loglevel=4′ and afterward restart the service with systemctl restart atomic-openshift-node.
Viewing OpenShift service logs:
# OpenShift 3.1 to OpenShift 3.9:
journalctl -u atomic-openshift-master-api
journalctl -u atomic-openshift-master-controllers
journalctl -u atomic-openshift-node
journalctl -u etcd # or 'etcd_container' for containerized install

# OpenShift 3.10 and later versions:
/usr/local/bin/master-logs api api
/usr/local/bin/master-logs controllers controllers
/usr/local/bin/master-logs etcd etcd
journalctl -u atomic-openshift-node
Change the docker daemon log level and add the parameter –log-level for the OPTIONS variable in dockers service file located in /etc/sysconfig/docker.
The available log levels are: ( debug, info, warn, error, fatal )
See the example below; to enable debug logging in /etc/sysconfig/docker to set log level equal to debug (After making the changes on the docker service you need to will restart with systemctl restart docker.):
OPTIONS='--insecure-registry=172.30.0.0/16 --selinux-enabled --log-level=debug'
The oc and oadm command also accept a loglevel option that can help get additional information. Value between 6 and 8 will provide extensive logging, API requests (loglevel 6), API headers (loglevel 7) and API responses received (loglevel 8):
oc whoami --loglevel=8
SkyDNS is the internal service discovery for OpenShift and DNS is important for OpenShift to function:
# Test full qualified cluster domain name
nslookup docker-registry.default.svc.cluster.local
# OR
dig +short docker-registry.default.svc.cluster.local

# Check if clusterip match the previous result
oc get svc/docker-registry -n default

# Test short name
nslookup docker-registry.default.svc
nslookup <endpoint-name>.<project-name>.svc
If short name doesn’t work look out if cluster.local is missing in dns search suffix. If resolution doesn’t work at all before enable debug logging, check if Dnsmasq service running and correctly configured. OpenShift uses a dispatcher script to maintain the DNS configuration of a node.
Add the options “–logspec ‘dns=10’” to the /etc/sysconfig/atomic-openshift-node service configuration on a node running skydns and restart the atomic-openshift-node service afterwards. There will then be skydns debug information in the journalctl logs.
OPTIONS="--loglevel=2 --logspec dns*=10"
- OpenShift Master API and Web Console
In the following example, the internal-master.domain.com is used by the internal cluster, and the master.domain.com is used by external clients
# Run the following commands on any node host
curl https://internal-master.domain.com:443/version
curl -k https://master.domain.com:443/healthz

# The OpenShift API service runs on all master instances. To see the status of the service, view the master-api pods in the kube-system project:
oc get pod -n kube-system -l openshift.io/component=api
oc get pod -n kube-system -o wide
curl -k --insecure https://$HOSTNAME:8443/healthz
- OpenShift Controller role
The OpenShift Container Platform controller service is available on all master nodes. The service runs in active/passive mode, which means it should only be running on one master.
# Verify the master host running the controller service
oc get -n kube-system cm openshift-master-controllers -o yaml
During the installation of OpenShift the playbooks generates a CA to sign every certificate in the cluster. One of the most common issues are expired node certificates. Below are a list of important certificate files:
# Is the OpenShift Certificate Authority, and it signs every other certificate unless specified otherwise.
/etc/origin/master/ca.crt

# Contains a bundle with the current and the old CA's (if exists) to trust them all. If there has been only one ca.crt, then this file is the same as ca.crt.
/etc/origin/master/ca-bundle.crt

# The internal API, also known as cluster internal address or the variable masterURL here all the internal components authenticates to access the API, such as nodes, routers and other services.
/etc/origin/master/master.server.crt

# Master controller certificate authenticates to kubernetes as a client using the admin.kubeconfig
/etc/origin/master/admin.crt

# Node certificates
/etc/origin/node/ca.crt                   # to be able to trust the API, a copy of masters CA bundle is placed in:
/etc/origin/node/server.crt               # to secure this communication
/etc/origin/node/system:node:{fqdn}.crt   # Nodes needs to authenticate to the Kubernetes API as a client.

# Etcd certificates
/etc/etcd/ca.crt                          # is the etcd CA, it is used to sign every certificate.
/etc/etcd/server.crt                      # is used by the etcd to listen to clients.
/etc/etcd/peer.crt                        # is used by etcd to authenticate as a client.

# Master certificates to auth to etcd
/etc/origin/master/master.etcd-ca.crt     # is a copy of /etc/etcd/ca.crt. Used to trust the etcd cluster.
/etc/origin/master/master.etcd-client.crt # is used to authenticate as a client of the etcd cluster.

# Services ca certificate. All self-signed internal certificates are signed by this CA.
/etc/origin/master/service-signer.crt
Here’s an example to check the validity of the master server certificate:
cat /etc/origin/master/master.server.crt | openssl x509 -text | grep -i Validity -A2
# OR
openssl x509 -enddate -noout -in /etc/origin/master/master.server.crt
It’s worth checking the documentation about how to re-deploy certificates on OpenShift.
On the etcd node (master) set source to etcd.conf file for most of the needed variables.
source /etc/etcd/etcd.conf
export ETCDCTL_API=3

# Set endpoint variable to include all etcd endpoints
ETCD_ALL_ENDPOINTS=` etcdctl  --cert=$ETCD_PEER_CERT_FILE --key=$ETCD_PEER_KEY_FILE --cacert=$ETCD_TRUSTED_CA_FILE --endpoints=$ETCD_LISTEN_CLIENT_URLS --write-out=fields   member list | awk '/ClientURL/{printf "%s%s",sep,$3; sep=","}'`

# Cluster status and health checks
etcdctl  --cert=$ETCD_PEER_CERT_FILE --key=$ETCD_PEER_KEY_FILE --cacert=$ETCD_TRUSTED_CA_FILE --endpoints=$ETCD_LISTEN_CLIENT_URLS --write-out=table  member list
etcdctl  --cert=$ETCD_PEER_CERT_FILE --key=$ETCD_PEER_KEY_FILE --cacert=$ETCD_TRUSTED_CA_FILE --endpoints=$ETCD_ALL_ENDPOINTS  --write-out=table endpoint status
etcdctl  --cert=$ETCD_PEER_CERT_FILE --key=$ETCD_PEER_KEY_FILE --cacert=$ETCD_TRUSTED_CA_FILE --endpoints=$ETCD_ALL_ENDPOINTS endpoint health
Check etcd database key entries:
etcdctl --cert=$ETCD_PEER_CERT_FILE --key=$ETCD_PEER_KEY_FILE --cacert=$ETCD_TRUSTED_CA_FILE --endpoints="https://$(hostname):2379" get /openshift.io --prefix --keys-only
To get detailed information about the pods running the internal registry run the following command:
oc get pods -n default | grep registry | awk '{ print $1 }' | xargs -i oc describe pod {}
For a basic health check that the internal registry is running and responding you need to “curl” the /healthz path. Normally this should return a 200 HTTP response:
Registry=$(oc get svc docker-registry -n default -o 'jsonpath={.spec.clusterIP}:{.spec.ports[0].port}')

curl -vk $Registry/healthz
# OR
curl -vk https://$Registry/healthz
If a persistent volume is attached to the registry make sure that the registry can write to the volume.
oc project default
oc rsh `oc get pods -o name -l docker-registry`

$ touch /registry/test-file
$ ls -la /registry/
$ rm /registry/test-file
$ exit
If the registry is insecure make sure you have edited the /etc/sysconfig/docker file and add –insecure-registry 172.30.0.0/16 to the OPTIONS parameter on the nodes.
For more information about testing the internal registry please have a look at the documentation about Accessing the Registry.
To increase the log level for OpenShift router pod, set loglevel=4 in the container args:
# Increase logging level
oc patch dc -n default router -p '[{"op": "add", "path": "/spec/template/spec/containers/0/args", "value":["--loglevel=4"]}]' --type=json

# View logs
oc logs <router-pod-name> -n default

# Remove logging change
oc patch dc -n default router -p '[{"op": "remove", "path": "/spec/template/spec/containers/0/args", "value":["--loglevel=4"]}]' --type=json
OpenShift router image version 3.3 and later, the logging for http requests can be forwarded to an external syslog server:
oc set env dc/router ROUTER_SYSLOG_ADDRESS=<syslog-server-ip> ROUTER_LOG_LEVEL=debug
If you are facing issues with ingress routes to your application run the below command to collect more information:
oc logs dc/router -n default
oc get dc/router -o yaml -n default
oc get route <route-name> -n <project-name>
oc get endpoints --all-namespaces
oc exec -it <router-pod-name> -- ls -la
oc exec -it <router-pod-name> -- find /var/lib/haproxy -regex ".*\(.map\|config.*\|.json\)" -print -exec cat {} \; > haproxy_configs_and_maps
Check if your application domain is /paas.domain.com/ and dig for an ANSWER containing the load balancer VIP address:
dig \*.paas.domain.com
Confirm that certificates are being severed out correctly by running the following:
echo -n | openssl s_client -connect :443 -servername myapp.paas.domain.com 2>&1 | openssl x509 -noout -text
curl -kv https://myapp.paas.domain.com
Please checkout the official Troubleshooting OpenShift SDN documentation
To get OpenFlow table export, connect to the openvswitch container and run following command:
docker exec openvswitch ovs-ofctl -O OpenFlow13 dump-flows br0
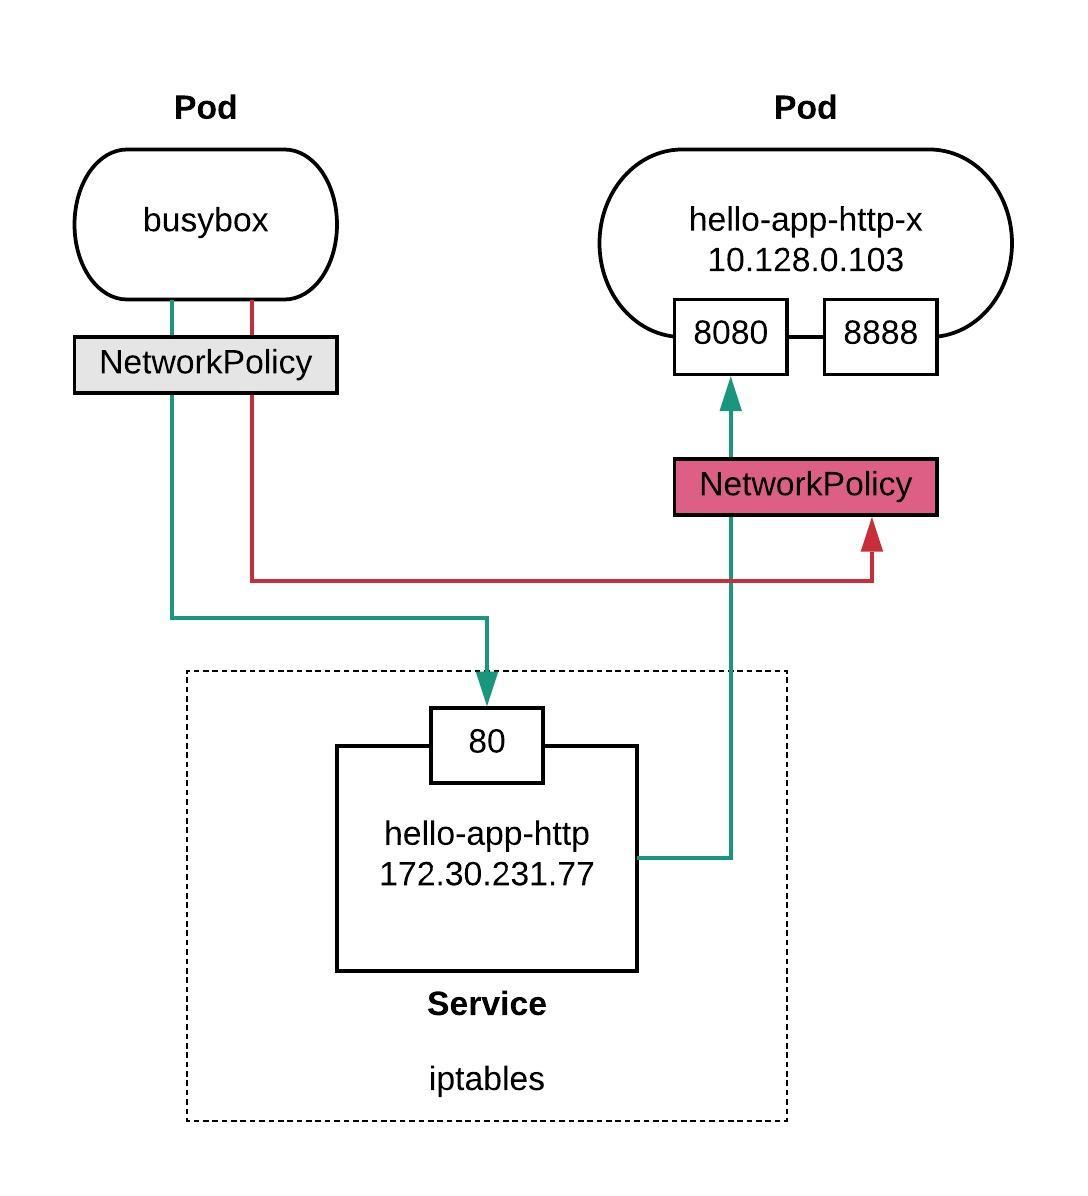
- OpenShift Namespace events
Useful to collect events from the namespace to identify pod creation issues before you did in the container logs:
oc get events [-n |--all-namespaces]
In the default namespace you find relevant events for monitoring or auditing a cluster, such as Node and resource events related to the OpenShift platform.
- OpenShift Pod and Container Logs
Container/pod logs can be viewed using the OpenShift oc command line. Add option “-p” to print the logs for the previous instance of the container in a pod if it exists and add option “-f” to stream the logs:
oc logs <pod-name> [-f]
The logs are saved to the worker nodes disk where the container/pod is running and it is located at:
/var/lib/docker/containers/<container-id>/<container-id>-json.log.
For setting the log file limits for containers on a worker node the –log-opt can be configured with max-size and max-file so that a containers logs are rolled over:
# cat /etc/sysconfig/docker
OPTIONS='--insecure-registry=172.30.0.0/16 --selinux-enabled --log-opt max-size=50m --log-opt max-file=5'

# Restart docker service for the changes to take effect.
systemctl restart docker
To remove all logs from a given container run the following commands:
cat /dev/null > /var/lib/docker/containers/<container-id>/<container-id>-json.log
# OR
cat /dev/null >  $(docker inspect --format='{{.LogPath}}' <container-id> )
To generate a list of the largest files run the following commands:
# Log files
find /var/lib/docker/ -name "*.log" -exec ls -sh {} \; | sort -n -r | head -20

# All container files
du -aSh /var/lib/docker/ | sort -n -r | head -n 10
Finding out the veth# interface of a docker container and use tcpdump to capture traffic more easily. The iflink of the container is the same as the ifindex of the veth#. You can get the iflink of the container as follows:
docker exec -it <container-name>  bash -c 'cat /sys/class/net/eth0/iflink'

# Let's say that the results in 14, then grep for 14
grep -l 14 /sys/class/net/veth*/ifindex

# Which will give a unique result on the worker node
/sys/class/net/veth12c4982/ifindex
Here a simple bash script to get the container and veth id’s:
#!/bin/bash
for container in $(docker ps -q); do
    iflink=`docker exec -it $container bash -c 'cat /sys/class/net/eth0/iflink'`
    iflink=`echo $iflink|tr -d '\r'`
    veth=`grep -l $iflink /sys/class/net/veth*/ifindex`
    veth=`echo $veth|sed -e 's;^.*net/\(.*\)/ifindex$;\1;'`
    echo $container:$veth
done
- OpenShift Builder Pod Logs
If you want to troubleshoot a particular build of “myapp” you can view logs with:
oc logs [bc/|dc/]<name> [-f]
To increase the logging level add a BUILD_LOGLEVEL environment variable to the BuildConfig strategy:
sourceStrategy:
...
  env:
    - name: "BUILD_LOGLEVEL"
      value: "5"
I hope you found this article useful and that it helped you troubleshoot OpenShift. Please let me know what you think and leave a comment.