Network Monitoring with Prometheus and Cumulus Linux

As promised in my previous article Install Prometheus and Grafana, this post is about how to monitor Cumulus Linux switches with Prometheus.

Let’s start directly by installing the Prometheus Node_Exporter:

sudo useradd --no-create-home --shell /bin/false node_exporter

tar xvf node_exporter-0.15.1.linux-amd64.tar.gz
sudo cp node_exporter-0.15.1.linux-amd64/node_exporter /usr/local/bin
sudo chown node_exporter:node_exporter /usr/local/bin/node_exporter

sudo bash -c 'cat << EOF > /etc/systemd/system/node_exporter.service
[Unit]
Description=Node Exporter
Wants=network-online.target
After=network-online.target

[Service]
User=node_exporter
Group=node_exporter
Type=simple
ExecStart=/usr/local/bin/node_exporter

[Install]
WantedBy=multi-user.target
EOF'

sudo systemctl daemon-reload
sudo systemctl start node_exporter
sudo systemctl status node_exporter

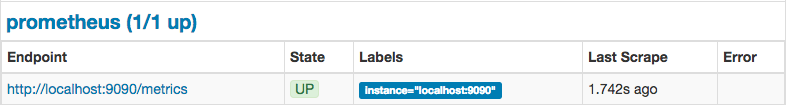
Check that the Node_Exporter service is correctly running and listing on tcp 9100 for the Prometheus server to collect the metrics from the switches:

vagrant@spine-2:~$ sudo systemctl status node_exporter
● node_exporter.service - Node Exporter
   Loaded: loaded (/etc/systemd/system/node_exporter.service; disabled)
   Active: active (running) since Thu 2018-03-22 13:41:26 UTC; 958ms ago
 Main PID: 5620 (node_exporter)
   CGroup: /system.slice/node_exporter.service
           └─5620 /usr/local/bin/node_exporter

Mar 22 13:41:26 spine-2 node_exporter[5620]: time="2018-03-22T13:41:26Z" level=info msg=" - sockstat" source="node_exporter.go:52"
Mar 22 13:41:26 spine-2 node_exporter[5620]: time="2018-03-22T13:41:26Z" level=info msg=" - bcache" source="node_exporter.go:52"
Mar 22 13:41:26 spine-2 node_exporter[5620]: time="2018-03-22T13:41:26Z" level=info msg=" - hwmon" source="node_exporter.go:52"
Mar 22 13:41:26 spine-2 node_exporter[5620]: time="2018-03-22T13:41:26Z" level=info msg=" - cpu" source="node_exporter.go:52"
Mar 22 13:41:26 spine-2 node_exporter[5620]: time="2018-03-22T13:41:26Z" level=info msg=" - stat" source="node_exporter.go:52"
Mar 22 13:41:26 spine-2 node_exporter[5620]: time="2018-03-22T13:41:26Z" level=info msg=" - timex" source="node_exporter.go:52"
Mar 22 13:41:26 spine-2 node_exporter[5620]: time="2018-03-22T13:41:26Z" level=info msg=" - textfile" source="node_exporter.go:52"
Mar 22 13:41:26 spine-2 node_exporter[5620]: time="2018-03-22T13:41:26Z" level=info msg=" - conntrack" source="node_exporter.go:52"
Mar 22 13:41:26 spine-2 node_exporter[5620]: time="2018-03-22T13:41:26Z" level=info msg=" - edac" source="node_exporter.go:52"
Mar 22 13:41:26 spine-2 node_exporter[5620]: time="2018-03-22T13:41:26Z" level=info msg="Listening on :9100" source="node_exporter.go:76"
vagrant@spine-2:~$

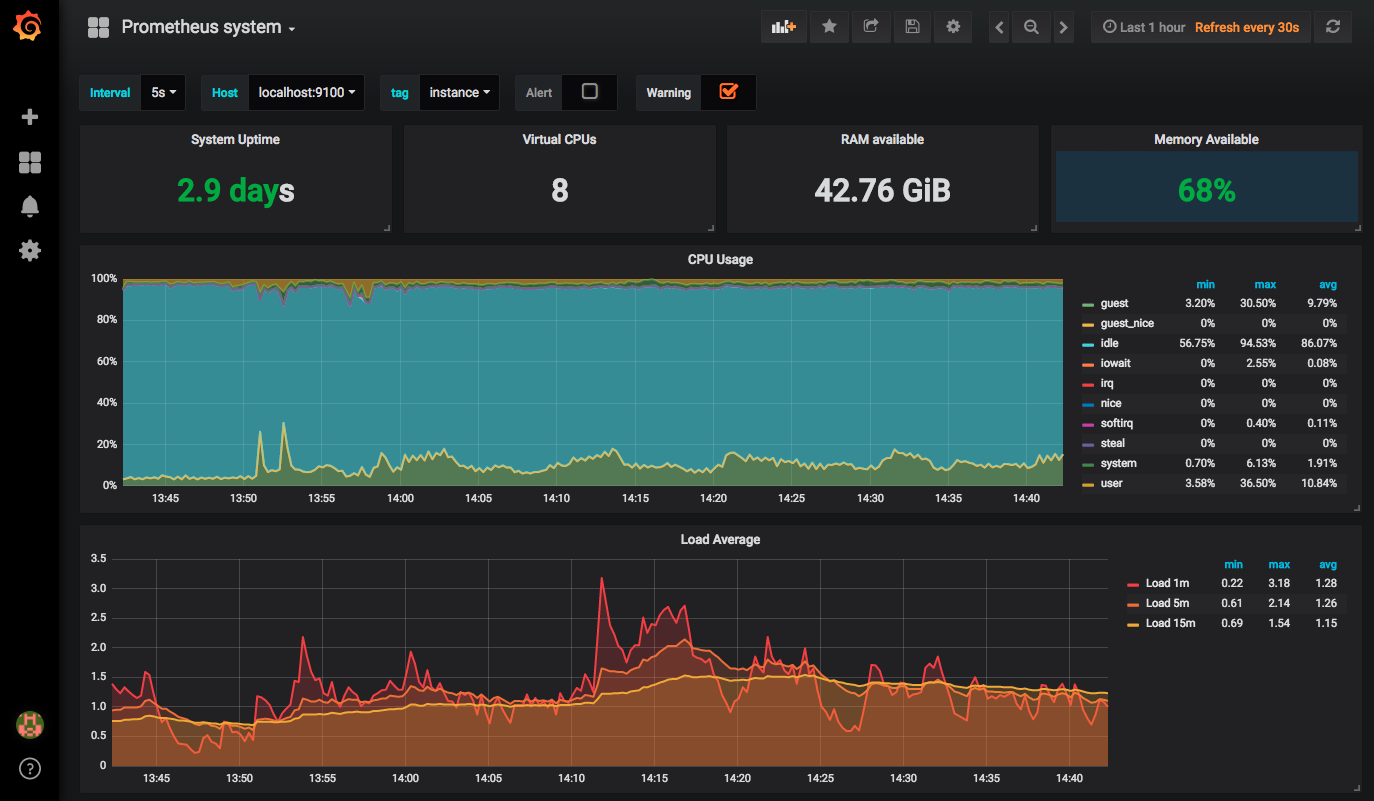
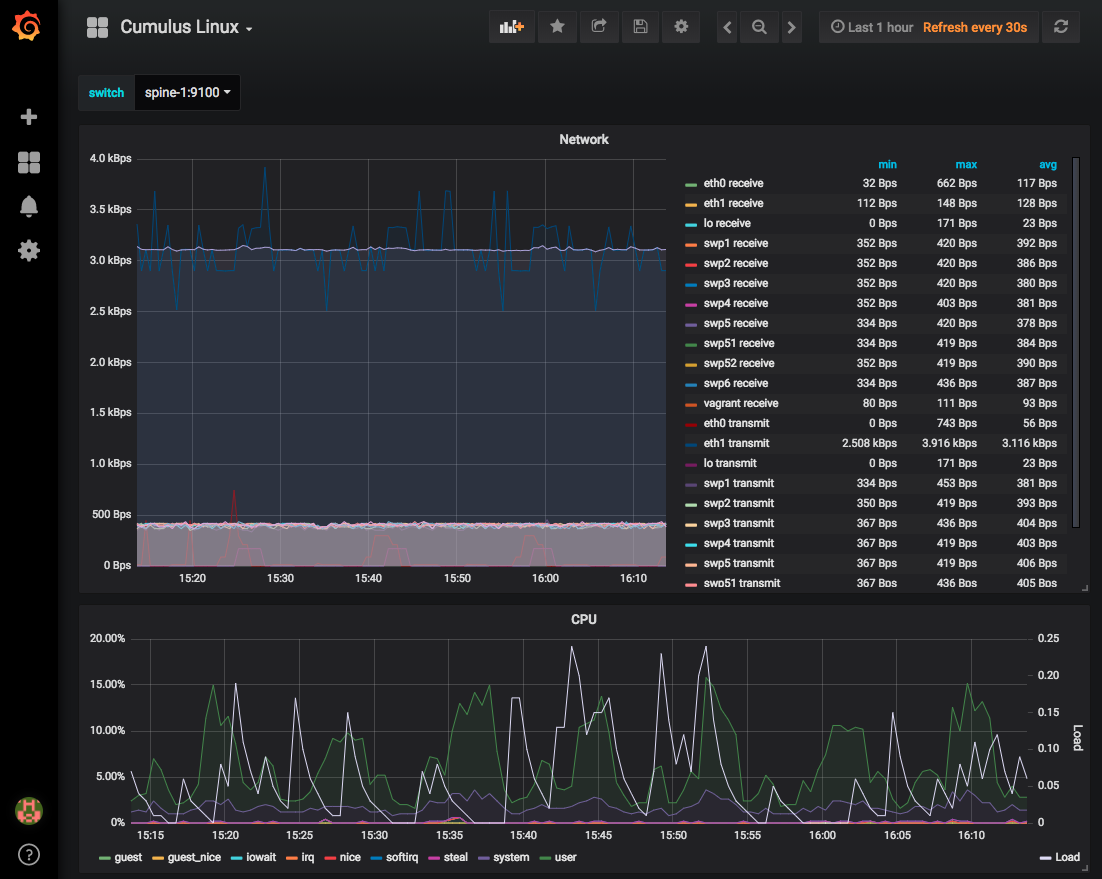
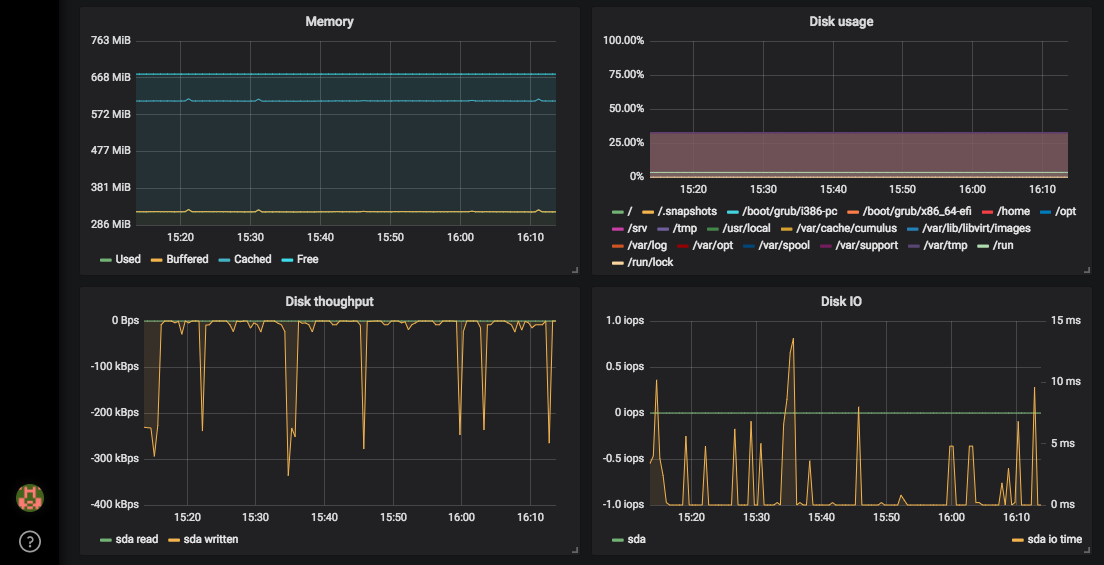
I created a simple dashboard in Grafana for the switches running Cumulus Linux, where you can find important metrics like throughput of the network interfaces, CPU load, Memory and disk related information:

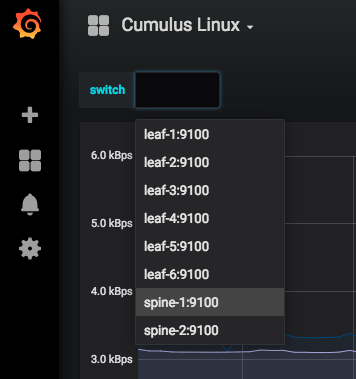
On the top right corner you can select the switch where you want to see metrics from:

You can also have a central monitoring dashboard where all performance metrics are shown:

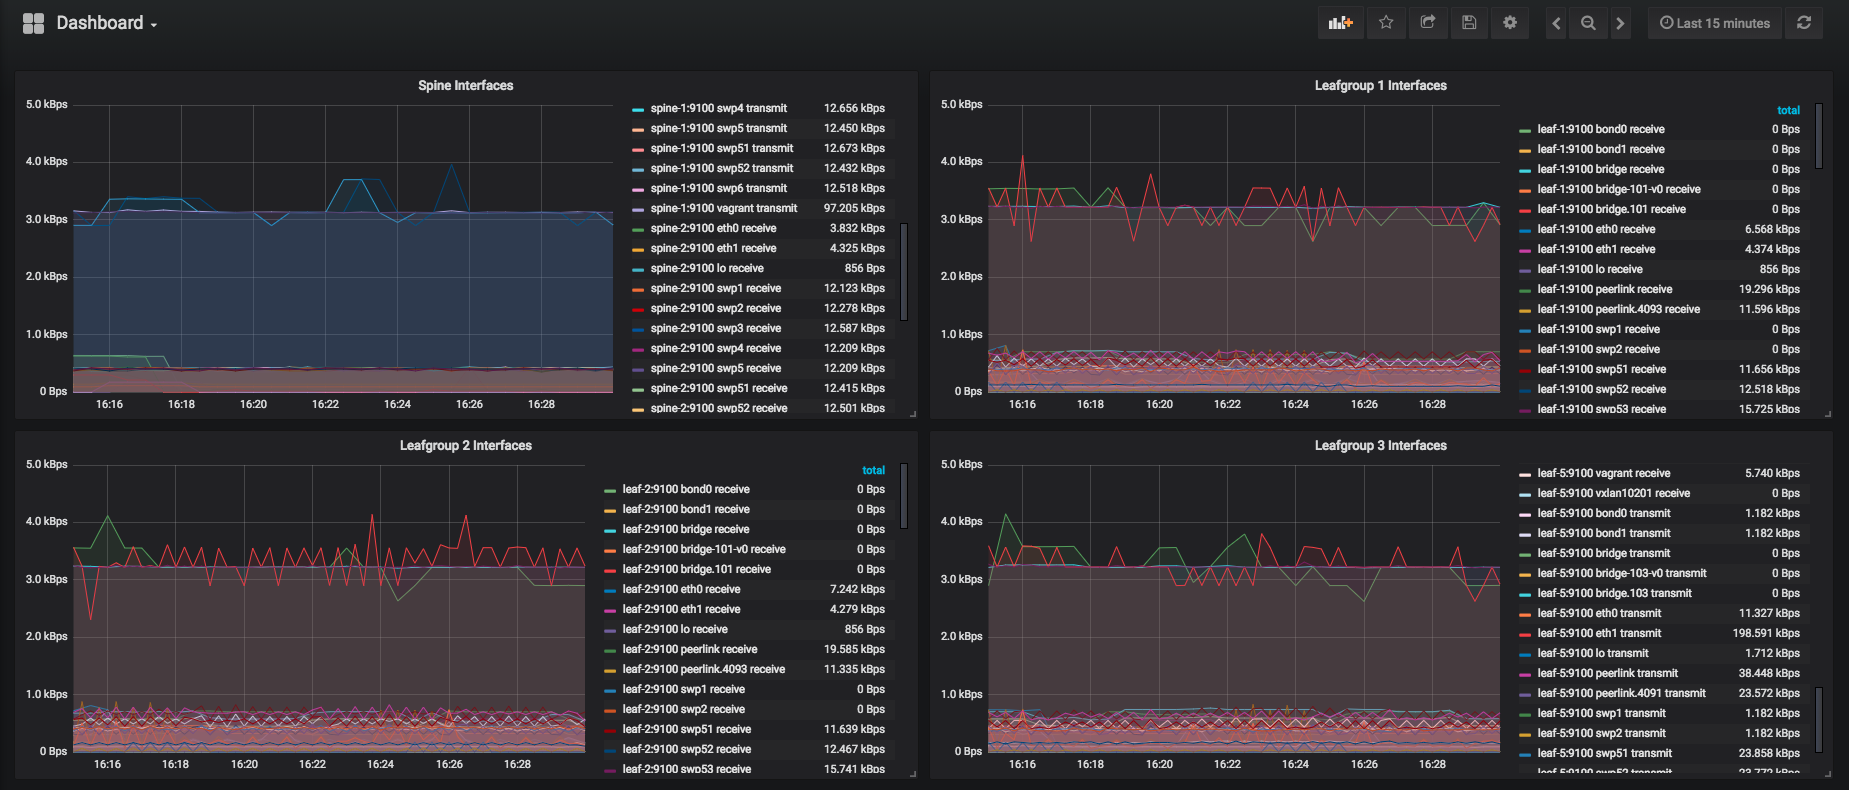
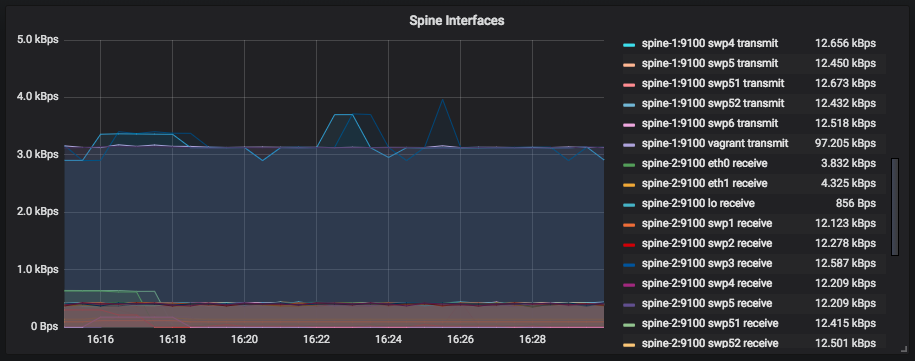
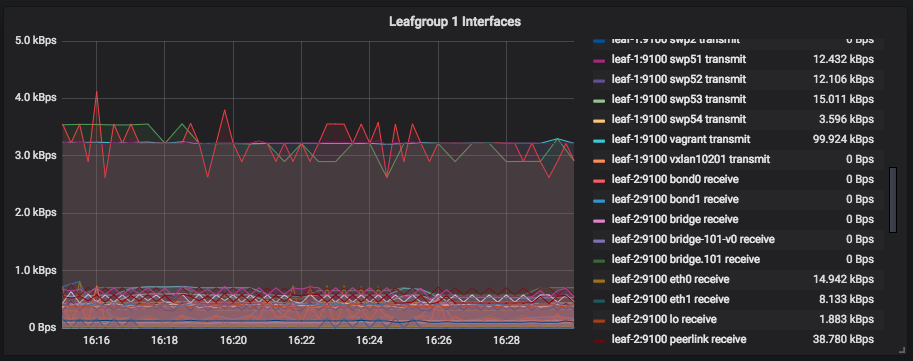
Here are detailed views with information about all interfaces from the different switch groups:

This is a very simple solution to monitor your Cumulus Linux switches and in combination with Cumulus NetQ enough to monitor your switch fabric.

FYI, I have used the following virtual topology BGP EVPN and VXLAN with Cumulus Linux.

Please share your feedback and leave a comment.

Install Prometheus and Grafana

Moving away from Cisco and using Open Networking whitebox switches with Cumulus Linux made me think about performance monitoring. In the past I was a fan of Solarwinds NPM but the traditional SNMP based monitoring is pretty outdated and not standard anymore when using Linux based operating systems. I was exploring different other options and came across Prometheus and Grafana.

This is post about how to install Prometheus and Grafana on a central monitoring server, the next post will be about how to integrate Cumulus Linux switches and report metrics to Prometheus and then visualise them with Grafana.

Let’s start installing Prometheus base packages:

sudo useradd --no-create-home --shell /bin/false prometheus
sudo mkdir /etc/prometheus
sudo mkdir /var/lib/prometheus
sudo chown prometheus:prometheus /etc/prometheus
sudo chown prometheus:prometheus /var/lib/prometheus

cd ~
curl -LO https://github.com/prometheus/prometheus/releases/download/v2.0.0/prometheus-2.0.0.linux-amd64.tar.gz
tar xvf prometheus-2.0.0.linux-amd64.tar.gz
sudo cp prometheus-2.0.0.linux-amd64/prometheus /usr/local/bin/
sudo cp prometheus-2.0.0.linux-amd64/promtool /usr/local/bin/
sudo chown prometheus:prometheus /usr/local/bin/prometheus
sudo chown prometheus:prometheus /usr/local/bin/promtool
sudo cp -r prometheus-2.0.0.linux-amd64/consoles /etc/prometheus
sudo cp -r prometheus-2.0.0.linux-amd64/console_libraries /etc/prometheus
sudo chown -R prometheus:prometheus /etc/prometheus/consoles
sudo chown -R prometheus:prometheus /etc/prometheus/console_libraries
rm -rf prometheus-2.0.0.linux-amd64.tar.gz prometheus-2.0.0.linux-amd64

sudo touch /etc/prometheus/prometheus.yml 
sudo chown prometheus:prometheus /etc/prometheus/prometheus.yml

sudo bash -c 'cat << EOF > /etc/systemd/system/prometheus.service
[Unit]
Description=Prometheus
Wants=network-online.target
After=network-online.target

[Service]
User=prometheus
Group=prometheus
Type=simple
ExecStart=/usr/local/bin/prometheus \
    --config.file /etc/prometheus/prometheus.yml \
    --storage.tsdb.path /var/lib/prometheus/ \
    --web.console.templates=/etc/prometheus/consoles \
    --web.console.libraries=/etc/prometheus/console_libraries

[Install]
WantedBy=multi-user.target
EOF'

We have now installed the Prometheus base package but to collect metrics you also need to install the Prometheus Node Exporter:

sudo useradd --no-create-home --shell /bin/false node_exporter

cd ~
curl -LO https://github.com/prometheus/node_exporter/releases/download/v0.15.1/node_exporter-0.15.1.linux-amd64.tar.gz
tar xvf node_exporter-0.15.1.linux-amd64.tar.gz
sudo cp node_exporter-0.15.1.linux-amd64/node_exporter /usr/local/bin
sudo chown node_exporter:node_exporter /usr/local/bin/node_exporter
rm -rf node_exporter-0.15.1.linux-amd64.tar.gz node_exporter-0.15.1.linux-amd64

sudo bash -c 'cat << EOF > /etc/systemd/system/node_exporter.service
[Unit]
Description=Node Exporter
Wants=network-online.target
After=network-online.target

[Service]
User=node_exporter
Group=node_exporter
Type=simple
ExecStart=/usr/local/bin/node_exporter

[Install]
WantedBy=multi-user.target
EOF'

Configure Prometheus and define node_exporter targets:

sudo bash -c 'cat << EOF > /etc/prometheus/prometheus.yml
global:
  scrape_interval: 15s

scrape_configs:
  - job_name: 'prometheus'
    scrape_interval: 5s
    static_configs:
      - targets: ['localhost:9090']
  - job_name: 'node_exporter'
    scrape_interval: 5s
    static_configs:
      - targets: ['localhost:9100']  
EOF'

Start services and access the web console:

sudo systemctl daemon-reload
sudo systemctl start prometheus
sudo systemctl start node_exporter

Access the Prometheus web console via http://localhost:9090:

Under “Status -> Targets” you can check if the services state is up:

Let’s continue by installing Grafana:

curl https://packagecloud.io/gpg.key | sudo apt-key add -
sudo add-apt-repository "deb https://packagecloud.io/grafana/stable/debian/ stretch main"
sudo apt-get update
sudo apt-get install grafana
sudo systemctl start grafana-server
sudo systemctl status grafana-server
sudo systemctl enable grafana-server

Now you can access Grafana via http://localhost:3000/. I would recommend putting a Ngnix reverse proxy in-front for SSL encryption.

In the web console we need to configure the data source and point it to Prometheus. To do that go to “settings” and select “data source”:

You should import the following Prometheus dashboard for Grafana otherwise you need to manually configure your dashboard:

For the install of Prometheus and the Node_Exporter I will write two Ansible roles which I will share later. Read my new post about Network Monitoring with Prometheus and Cumulus Linux!

Please share your feedback and leave a comment.