After my previous articles about troubleshooting and to validate OpenShift using Ansible, I wanted to continue and show how SysDig is helping you to identify potentials issues on your nodes or container platform before they occur.
The open source version is a simple but very powerful tool to inspect your linux host via the command line but it has no capabilities to centrally monitor or store capture information. The enterprise version provides these capabilities like a web console and centrally stores metrics, it is also able to trigger remote captures without the need to connect to the host.
Sysdig Open Source
Let’s install sysdig open source, here the official SysDig installation guide.
# Host install
curl -s https://s3.amazonaws.com/download.draios.com/stable/install-sysdig | sudo bash

# Alternatively the container based install
yum -y install kernel-devel-$(uname -r)
docker pull sysdig/sysdig
docker run -i -t --name sysdig --privileged -v /var/run/docker.sock:/host/var/run/docker.sock -v /dev:/host/dev -v /proc:/host/proc:ro -v /boot:/host/boot:ro -v /lib/modules:/host/lib/modules:ro -v /usr:/host/usr:ro sysdig/sysdig
The csysdig command is nice and user friendly menu driven interface to see real-time system call information of your host. To collect information from Kubernetes or OpenShift please use the option [-kK] like seen in the example below:
csysdig -k https://localhost:8443 -K /etc/origin/master/admin.crt:/etc/origin/master/admin.key
For more information about how to use csysdig please have a look at the manual or watch the short Youtube video.
The main sysdig command is showing output directly in the terminal session and you are able to apply filters (chisels) to more granularly see the system calls. Like with csysdig, the option [-kK] enabled Kubernetes integration:
sysdig -k https://localhost:8443 -K /etc/origin/master/admin.crt:/etc/origin/master/admin.key
Here some useful commands to inspect Kubernetes or OpenShift events:
# Monitor Kubernetes namespace ip communication:
sudo sysdig -A -s8192 "fd.type in (ipv4, ipv6) and (k8s.ns.name=<-NAMESPACE-NAME->)" -k https://localhost:8443 -K /etc/origin/master/admin.crt:/e/origin/master/admin.key

# Monitor namespace and pod name, the 2nd command filters to only show GET requests:
sudo sysdig -A -s8192 "fd.type in (ipv4, ipv6) and (k8s.ns.name=<-NAMESPACE-NAME-> and k8s.pod.name=<-POD-NAME->)" -k https://localhost:8443 -K /etc/origin/master/admin.crt:/etc/origin/master/admin.key
sudo sysdig -A -s8192 "fd.type in (ipv4, ipv6) and (k8s.ns.name=<-NAMESPACE-NAME-> and k8s.pod.name=<-POD-NAME->) and evt.buffer contai GET" -k https://localhost:8443 -K /etc/origin/master/admin.crt:/etc/origin/master/admin.key

# Monitor ns and pod names and apply chisel echo_fds:
sudo sysdig -A -s8192 "fd.type in (ipv4, ipv6) and (k8s.ns.name=<-NAMESPACE-NAME-> and k8s.pod.name=<-POD-NAME->)" -c echo_fds -k https://localhost:8443 -K /etc/origin/master/admin.crt:/etc/origin/master/admin.key
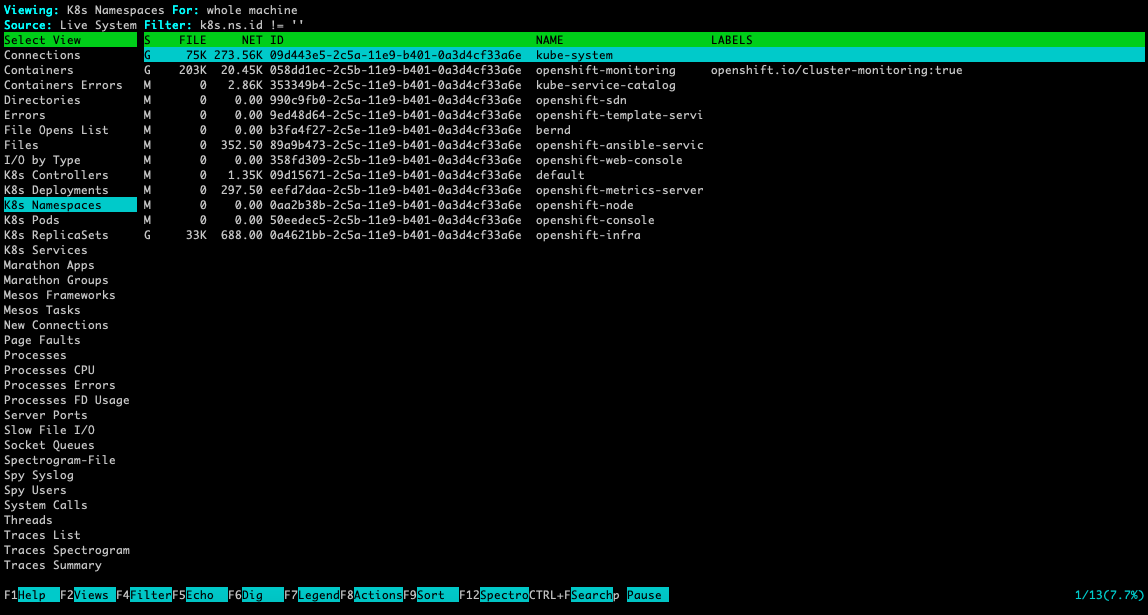
SysDig example
This capture is an http request between an busybox pod (name: busybox-2-hjhq8 ip: 10.128.0.81) via service (name: hello-app-http ip: 172.30.43.111) to the hello-openshift pod (name: hello-app-http-1-8v57x ip: 10.128.0.77) in the namespace myproject. I use a simple “wget -S –spider http://hello-app-http/” to simulate the request:
# Command to capture ip communication in myproject namespace including dnsmasq and wget processes:
sudo sysdig -s2000 -A -pk "fd.type in (ipv4, ipv6) and (k8s.ns.name=myproject or proc.name=dnsmasq) or proc.name=wget" -k https://localhost:8443 -K /etc/origin/master/admin.crt:/etc/origin/master/admin.key

# Output:
70739 19:36:51.401062017 1 busybox-2-hjhq8 (4d84d98d46f1) wget (84856:26) < socket fd=3(<4>)
70741 19:36:51.401062878 1 busybox-2-hjhq8 (4d84d98d46f1) wget (84856:26) > connect fd=3(<4>)
70748 19:36:51.401072194 1 busybox-2-hjhq8 (4d84d98d46f1) wget (84856:26) < connect res=0 tuple=10.128.0.81:44993->172.26.11.254:53
70749 19:36:51.401074599 1 busybox-2-hjhq8 (4d84d98d46f1) wget (84856:26) > sendto fd=3(<4u>10.128.0.81:44993->172.26.11.254:53) size=60 tuple=NULL
71083 19:36:51.401575859 0  (host) dnsmasq (20933:20933) > recvmsg fd=6(<4u>172.26.11.254:53)
71087 19:36:51.401582008 0  (host) dnsmasq (20933:20933) < recvmsg res=60 size=60 data= hello-app-httpmyprojectsvcclusterlocal tuple=10.128.0.81:44993->172.26.11.254:53
71088 19:36:51.401584101 0  (host) dnsmasq (20933:20933) > ioctl fd=6(<4u>10.128.0.81:44993->172.26.11.254:53) request=8910 argument=7FFE208E30C0
71089 19:36:51.401586692 0  (host) dnsmasq (20933:20933) < ioctl res=0
71108 19:36:51.401623408 0  (host) dnsmasq (20933:20933) < socket fd=58(<4>)
71109 19:36:51.401624563 0  (host) dnsmasq (20933:20933) > fcntl fd=58(<4>) cmd=4(F_GETFL)
71110 19:36:51.401625584 0  (host) dnsmasq (20933:20933) < fcntl res=2(/dev/null)
71111 19:36:51.401626259 0  (host) dnsmasq (20933:20933) > fcntl fd=58(<4>) cmd=5(F_SETFL)
71112 19:36:51.401626825 0  (host) dnsmasq (20933:20933) < fcntl res=0(/dev/null)
71113 19:36:51.401627787 0  (host) dnsmasq (20933:20933) > bind fd=58(<4>)
71129 19:36:51.401680355 0  (host) dnsmasq (20933:20933) < bind res=0 addr=0.0.0.0:22969
71130 19:36:51.401681698 0  (host) dnsmasq (20933:20933) > sendto fd=58(<4u>0.0.0.0:22969) size=60 tuple=0.0.0.0:22969->127.0.0.1:53
71131 19:36:51.401715726 0  (host) dnsmasq (20933:20933) < sendto res=60 data=
hello-app-httpmyprojectsvcclusterlocal
71469 19:36:51.402632442 1  (host) dnsmasq (20933:20933) > recvfrom fd=58(<4u>127.0.0.1:53->127.0.0.1:22969) size=5131
71474 19:36:51.402636604 1  (host) dnsmasq (20933:20933) < recvfrom res=114 data=
hello-app-httpmyprojectsvcclusterlocal)<*nsdns)
hostmaster)\`tp :< tuple=127.0.0.1:53->0.0.0.0:22969
71479 19:36:51.402643363 1  (host) dnsmasq (20933:20933) > sendmsg fd=6(<4u>10.128.0.81:44993->172.26.11.254:53) size=114 tuple=172.26.11.254:53->10.128.0.81:44993
71492 19:36:51.402666311 1  (host) dnsmasq (20933:20933) < sendmsg res=114 data=
hello-app-httpmyprojectsvcclusterlocal)<*nsdns)
hostmaster)\`tp :<
71493 19:36:51.402668199 1  (host) dnsmasq (20933:20933) > close fd=58(<4u>127.0.0.1:53->127.0.0.1:22969)
71494 19:36:51.402669009 1  (host) dnsmasq (20933:20933) < close res=0
80786 19:36:51.430143868 1 busybox-2-hjhq8 (4d84d98d46f1) wget (84856:26) < sendto res=60 data= hello-app-httpmyprojectsvcclusterlocal 80793 19:36:51.430153453 1 busybox-2-hjhq8 (4d84d98d46f1) wget (84856:26) > recvfrom fd=3(<4u>10.128.0.81:44993->172.26.11.254:53) size=512
80794 19:36:51.430158626 1 busybox-2-hjhq8 (4d84d98d46f1) wget (84856:26) < recvfrom res=114 data=
hello-app-httpmyprojectsvcclusterlocal)<*nsdns)
hostmaster)\`tp :< tuple=NULL 80795 19:36:51.430160257 1 busybox-2-hjhq8 (4d84d98d46f1) wget (84856:26) > close fd=3(<4u>10.128.0.81:44993->172.26.11.254:53)
80796 19:36:51.430161712 1 busybox-2-hjhq8 (4d84d98d46f1) wget (84856:26) < close res=0
80835 19:36:51.430260103 1 busybox-2-hjhq8 (4d84d98d46f1) wget (84856:26) < socket fd=3(<4>)
80838 19:36:51.430261013 1 busybox-2-hjhq8 (4d84d98d46f1) wget (84856:26) > connect fd=3(<4>)
80840 19:36:51.430269080 1 busybox-2-hjhq8 (4d84d98d46f1) wget (84856:26) < connect res=0 tuple=10.128.0.81:41405->172.26.11.254:53
80841 19:36:51.430271011 1 busybox-2-hjhq8 (4d84d98d46f1) wget (84856:26) > sendto fd=3(<4u>10.128.0.81:41405->172.26.11.254:53) size=60 tuple=NULL
80874 19:36:51.430433333 1  (host) dnsmasq (20933:20933) > recvmsg fd=6(<4u>10.128.0.81:44993->172.26.11.254:53)
80879 19:36:51.430439631 1  (host) dnsmasq (20933:20933) < recvmsg res=60 size=60 data= hello-app-httpmyprojectsvcclusterlocal tuple=10.128.0.81:41405->172.26.11.254:53
80881 19:36:51.430454839 1  (host) dnsmasq (20933:20933) > ioctl fd=6(<4u>10.128.0.81:41405->172.26.11.254:53) request=8910 argument=7FFE208E30C0
80885 19:36:51.430457716 1  (host) dnsmasq (20933:20933) < ioctl res=0
80895 19:36:51.430493317 1  (host) dnsmasq (20933:20933) < socket fd=58(<4>)
80896 19:36:51.430494522 1  (host) dnsmasq (20933:20933) > fcntl fd=58(<4>) cmd=4(F_GETFL)
80897 19:36:51.430495527 1  (host) dnsmasq (20933:20933) < fcntl res=2(/dev/null)
80898 19:36:51.430496189 1  (host) dnsmasq (20933:20933) > fcntl fd=58(<4>) cmd=5(F_SETFL)
80899 19:36:51.430496769 1  (host) dnsmasq (20933:20933) < fcntl res=0(/dev/null)
80900 19:36:51.430497538 1  (host) dnsmasq (20933:20933) > bind fd=58(<4>)
80913 19:36:51.430551876 1  (host) dnsmasq (20933:20933) < bind res=0 addr=0.0.0.0:64640
80914 19:36:51.430553226 1  (host) dnsmasq (20933:20933) > sendto fd=58(<4u>0.0.0.0:64640) size=60 tuple=0.0.0.0:64640->127.0.0.1:53
80922 19:36:51.430581962 1  (host) dnsmasq (20933:20933) < sendto res=60 data=
:=hello-app-httpmyprojectsvcclusterlocal
81032 19:36:51.430806106 1  (host) dnsmasq (20933:20933) > recvfrom fd=58(<4u>127.0.0.1:53->127.0.0.1:64640) size=5131
81035 19:36:51.430809074 1  (host) dnsmasq (20933:20933) < recvfrom res=76 data= :=hello-app-httpmyprojectsvcclusterlocal+o tuple=127.0.0.1:53->0.0.0.0:64640
81040 19:36:51.430818116 1  (host) dnsmasq (20933:20933) > sendmsg fd=6(<4u>10.128.0.81:41405->172.26.11.254:53) size=76 tuple=172.26.11.254:53->10.128.0.81:41405
81051 19:36:51.430840305 1  (host) dnsmasq (20933:20933) < sendmsg res=76 data=
hello-app-httpmyprojectsvcclusterlocal+o
81052 19:36:51.430842129 1  (host) dnsmasq (20933:20933) > close fd=58(<4u>127.0.0.1:53->127.0.0.1:64640)
81053 19:36:51.430842956 1  (host) dnsmasq (20933:20933) < close res=0
84676 19:36:51.436248790 1 busybox-2-hjhq8 (4d84d98d46f1) wget (84856:26) < sendto res=60 data= hello-app-httpmyprojectsvcclusterlocal 84683 19:36:51.436254334 1 busybox-2-hjhq8 (4d84d98d46f1) wget (84856:26) > recvfrom fd=3(<4u>10.128.0.81:41405->172.26.11.254:53) size=512
84684 19:36:51.436256892 1 busybox-2-hjhq8 (4d84d98d46f1) wget (84856:26) < recvfrom res=76 data= hello-app-httpmyprojectsvcclusterlocal+o tuple=NULL 84685 19:36:51.436264998 1 busybox-2-hjhq8 (4d84d98d46f1) wget (84856:26) > close fd=3(<4u>10.128.0.81:41405->172.26.11.254:53)
84686 19:36:51.436265743 1 busybox-2-hjhq8 (4d84d98d46f1) wget (84856:26) < close res=0
85420 19:36:51.437492301 1 busybox-2-hjhq8 (4d84d98d46f1) wget (84856:26) < socket fd=3(<4>)
85421 19:36:51.437493337 1 busybox-2-hjhq8 (4d84d98d46f1) wget (84856:26) > connect fd=3(<4>)
86222 19:36:51.438494771 1 busybox-2-hjhq8 (4d84d98d46f1) wget (84856:26) < connect res=0 tuple=10.128.0.81:39656->172.30.43.111:80
86226 19:36:51.438497506 1 busybox-2-hjhq8 (4d84d98d46f1) wget (84856:26) > fcntl fd=3(<4t>10.128.0.81:39656->172.30.43.111:80) cmd=4(F_GETFL)
86228 19:36:51.438498484 1 busybox-2-hjhq8 (4d84d98d46f1) wget (84856:26) < fcntl res=2(/dev/pts/1)
86229 19:36:51.438499943 1 busybox-2-hjhq8 (4d84d98d46f1) wget (84856:26) > ioctl fd=3(<4t>10.128.0.81:39656->172.30.43.111:80) request=5401 argument=7FFDBF5E434C
86233 19:36:51.438501658 1 busybox-2-hjhq8 (4d84d98d46f1) wget (84856:26) < ioctl res=-25(ENOTTY) 86242 19:36:51.438509833 1 busybox-2-hjhq8 (4d84d98d46f1) wget (84856:26) > write fd=3(<4t>10.128.0.81:39656->172.30.43.111:80) size=105
86285 19:36:51.438557309 1 busybox-2-hjhq8 (4d84d98d46f1) wget (84856:26) < write res=105 data= GET / HTTP/1.1 Host: hello-app-http.myproject.svc.cluster.local User-Agent: Wget Connection: close 86291 19:36:51.438561615 1 busybox-2-hjhq8 (4d84d98d46f1) wget (84856:26) > read fd=3(<4t>10.128.0.81:39656->172.30.43.111:80) size=4096
107714 19:36:51.478518400 0 hello-app-http-1-8v57x (5145dc0ea61e) hello-openshift (11185:7) < accept fd=6(<4t>10.128.0.81:39656->10.128.0.77:8080) tuple=10.128.0.81:39656->10.128.0.77:8080 queuepct=0 queuelen=0 queuemax=128
107772 19:36:51.478636516 0 hello-app-http-1-8v57x (5145dc0ea61e) hello-openshift (11185:7) > read fd=6(<4t>10.128.0.81:39656->10.128.0.77:8080) size=4096
107773 19:36:51.478640241 0 hello-app-http-1-8v57x (5145dc0ea61e) hello-openshift (11185:7) < read res=105 data= GET / HTTP/1.1 Host: hello-app-http.myproject.svc.cluster.local User-Agent: Wget Connection: close 107857 19:36:51.478817861 0 hello-app-http-1-8v57x (5145dc0ea61e) hello-openshift (11185:7) > write fd=6(<4t>10.128.0.81:39656->10.128.0.77:8080) size=153
107869 19:36:51.478870349 0 hello-app-http-1-8v57x (5145dc0ea61e) hello-openshift (11185:7) < write res=153 data= HTTP/1.1 200 OK Date: Sun, 10 Feb 2019 19:36:51 GMT Content-Length: 17 Content-Type: text/plain; charset=utf-8 Connection: close Hello OpenShift! 107886 19:36:51.478892928 0 hello-app-http-1-8v57x (5145dc0ea61e) hello-openshift (11185:7) > close fd=6(<4t>10.128.0.81:39656->10.128.0.77:8080)
107887 19:36:51.478893676 0 hello-app-http-1-8v57x (5145dc0ea61e) hello-openshift (11185:7) < close res=0
107899 19:36:51.478998208 0 busybox-2-hjhq8 (4d84d98d46f1) wget (84856:26) < read res=153 data= HTTP/1.1 200 OK Date: Sun, 10 Feb 2019 19:36:51 GMT Content-Length: 17 Content-Type: text/plain; charset=utf-8 Connection: close Hello OpenShift! 108908 19:36:51.480114626 0 busybox-2-hjhq8 (4d84d98d46f1) wget (84856:26) > close fd=3(<4t>10.128.0.81:39656->172.30.43.111:80)
108910 19:36:51.480115482 0 busybox-2-hjhq8 (4d84d98d46f1) wget (84856:26) < close res=0
112966 19:36:51.488041049 0 hello-app-http-1-8v57x (5145dc0ea61e) hello-openshift (11183:6) < accept fd=6(<4t>10.128.0.1:55052->10.128.0.77:8080) tuple=10.128.0.1:55052->10.128.0.77:8080 queuepct=0 queuelen=0 queuemax=128
113001 19:36:51.488096304 0 hello-app-http-1-8v57x (5145dc0ea61e) hello-openshift (11183:6) > read fd=6(<4t>10.128.0.1:55052->10.128.0.77:8080) size=4096
113002 19:36:51.488098693 0 hello-app-http-1-8v57x (5145dc0ea61e) hello-openshift (11183:6) < read res=0 data= 113005 19:36:51.488105730 0 hello-app-http-1-8v57x (5145dc0ea61e) hello-openshift (11183:6) > close fd=6(<4t>10.128.0.1:55052->10.128.0.77:8080)
113006 19:36:51.488106302 0 hello-app-http-1-8v57x (5145dc0ea61e) hello-openshift (11183:6) < close res=0
Below a list of some more useful sysdig cli examples:
# Sysdig Chisels and Filters:
sudo sysdig -cl

# To find out more information about a particular chisel:
sudo sysdig -i lscontainers

# To view a list of available field classes, fields and their description:
sudo sysdig -l

# Create and write sysdig trace files, 2nd option sets byte limit for trace file:
sudo sysdig -w mytrace.scap
sudo sysdig -s 8192 -w trace.scap

# Read sysdig trace files, 2nd option read and filter based on proc.name:
sudo sysdig -r trace.scap
sudo sysdig -r trace.scap proc.name=dnsmasq

# Monitor linux processes:
sudo sysdig -c ps

# Monitor linux processes by CPU utilisation:
sudo sysdig -c topprocs_cpu

# Monitor network connections:
sudo sysdig -c netstat
sudo sysdig -c topconns
sudo sysdig -c topprocs_net

# Monitor system file i/o:
sudo sysdig -c echo_fds
sudo sysdig -c topprocs_file

# Troubleshoot system performance:
sudo sysdig -c bottlenecks

# Monitor process execution time
sudo sysdig -c proc_exec_time

# Monitor network i/o performance
sudo sysdig -c netlower 1

# Watch log entries
sudo sysdig -c spy_logs

# Monitor http requests:
sudo sysdig -c httplog
sudo sysdig -c httptop [Print Top HTTP Requests]
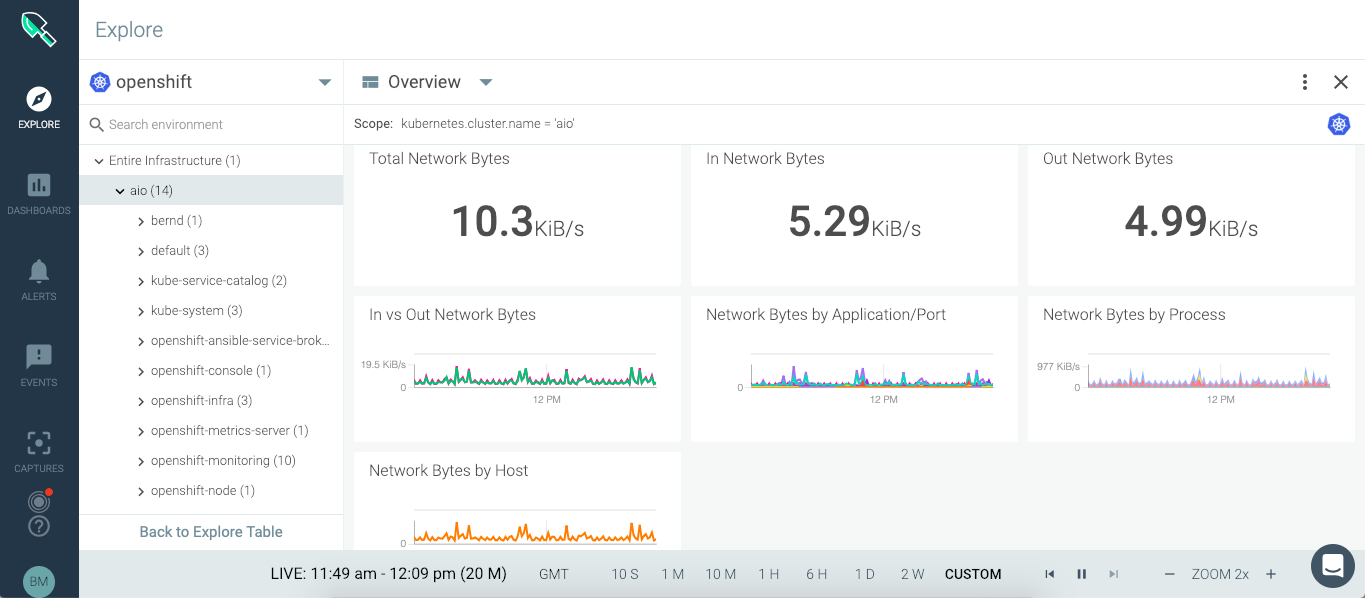
SysDig Monitor Enterprise
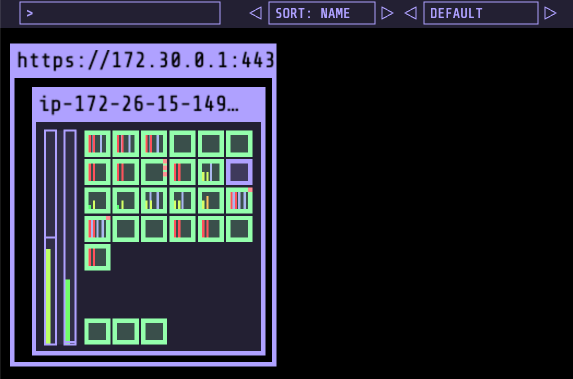
The paid enterprise version provides a web console to centrally access metrics and events from your fleet of monitored nodes.
You can run SysDig enterprise directly on OpenShift as DaemonSet and deploy the agent to all nodes in the cluster. For more detailed information about Kubernetes or OpenShift installation, read the official documentation.
oc adm new-project sysdig-agent --node-selector='app=sysdig-agent'
oc project sysdig-agent
oc label node --all "app=sysdig-agent"
oc create serviceaccount sysdig-agent
oc adm policy add-scc-to-user privileged -n sysdig-agent -z sysdig-agent
oc adm policy add-cluster-role-to-user cluster-reader -n sysdig-agent -z sysdig-agent

wget https://raw.githubusercontent.com/draios/sysdig-cloud-scripts/master/agent_deploy/kubernetes/sysdig-agent-daemonset-v2.yaml
wget https://raw.githubusercontent.com/draios/sysdig-cloud-scripts/master/agent_deploy/kubernetes/sysdig-agent-configmap.yaml
oc create secret generic sysdig-agent --from-literal=access-key=<-YOUR-ACCESS-KEY->

# Edit sysdig-agent-daemonset-v2.yaml to uncomment the line: serviceAccount: sysdig-agent and edit sysdig-agent-configmap.yaml to uncomment the line: new_k8s: true
# This allows kube-state-metrics to be automatically detected, monitored, and displayed in Sysdig Monitor.
# Edit sysdig-agent-configmap.yaml to uncomment the line: k8s_cluster_name: and add your cluster name.

oc create -f sysdig-agent-daemonset-v2.yaml
oc create -f sysdig-agent-configmap.yaml
SysDig is a great tool to monitor and even further provides you the possibility to troubleshoot in depth your linux hosts and container platforms.