Install Prometheus and Grafana

Moving away from Cisco and using Open Networking whitebox switches with Cumulus Linux made me think about performance monitoring. In the past I was a fan of Solarwinds NPM but the traditional SNMP based monitoring is pretty outdated and not standard anymore when using Linux based operating systems. I was exploring different other options and came across Prometheus and Grafana.

This is post about how to install Prometheus and Grafana on a central monitoring server, the next post will be about how to integrate Cumulus Linux switches and report metrics to Prometheus and then visualise them with Grafana.

Let’s start installing Prometheus base packages:

sudo useradd --no-create-home --shell /bin/false prometheus
sudo mkdir /etc/prometheus
sudo mkdir /var/lib/prometheus
sudo chown prometheus:prometheus /etc/prometheus
sudo chown prometheus:prometheus /var/lib/prometheus

cd ~
curl -LO https://github.com/prometheus/prometheus/releases/download/v2.0.0/prometheus-2.0.0.linux-amd64.tar.gz
tar xvf prometheus-2.0.0.linux-amd64.tar.gz
sudo cp prometheus-2.0.0.linux-amd64/prometheus /usr/local/bin/
sudo cp prometheus-2.0.0.linux-amd64/promtool /usr/local/bin/
sudo chown prometheus:prometheus /usr/local/bin/prometheus
sudo chown prometheus:prometheus /usr/local/bin/promtool
sudo cp -r prometheus-2.0.0.linux-amd64/consoles /etc/prometheus
sudo cp -r prometheus-2.0.0.linux-amd64/console_libraries /etc/prometheus
sudo chown -R prometheus:prometheus /etc/prometheus/consoles
sudo chown -R prometheus:prometheus /etc/prometheus/console_libraries
rm -rf prometheus-2.0.0.linux-amd64.tar.gz prometheus-2.0.0.linux-amd64

sudo touch /etc/prometheus/prometheus.yml 
sudo chown prometheus:prometheus /etc/prometheus/prometheus.yml

sudo bash -c 'cat << EOF > /etc/systemd/system/prometheus.service
[Unit]
Description=Prometheus
Wants=network-online.target
After=network-online.target

[Service]
User=prometheus
Group=prometheus
Type=simple
ExecStart=/usr/local/bin/prometheus \
    --config.file /etc/prometheus/prometheus.yml \
    --storage.tsdb.path /var/lib/prometheus/ \
    --web.console.templates=/etc/prometheus/consoles \
    --web.console.libraries=/etc/prometheus/console_libraries

[Install]
WantedBy=multi-user.target
EOF'

We have now installed the Prometheus base package but to collect metrics you also need to install the Prometheus Node Exporter:

sudo useradd --no-create-home --shell /bin/false node_exporter

cd ~
curl -LO https://github.com/prometheus/node_exporter/releases/download/v0.15.1/node_exporter-0.15.1.linux-amd64.tar.gz
tar xvf node_exporter-0.15.1.linux-amd64.tar.gz
sudo cp node_exporter-0.15.1.linux-amd64/node_exporter /usr/local/bin
sudo chown node_exporter:node_exporter /usr/local/bin/node_exporter
rm -rf node_exporter-0.15.1.linux-amd64.tar.gz node_exporter-0.15.1.linux-amd64

sudo bash -c 'cat << EOF > /etc/systemd/system/node_exporter.service
[Unit]
Description=Node Exporter
Wants=network-online.target
After=network-online.target

[Service]
User=node_exporter
Group=node_exporter
Type=simple
ExecStart=/usr/local/bin/node_exporter

[Install]
WantedBy=multi-user.target
EOF'

Configure Prometheus and define node_exporter targets:

sudo bash -c 'cat << EOF > /etc/prometheus/prometheus.yml
global:
  scrape_interval: 15s

scrape_configs:
  - job_name: 'prometheus'
    scrape_interval: 5s
    static_configs:
      - targets: ['localhost:9090']
  - job_name: 'node_exporter'
    scrape_interval: 5s
    static_configs:
      - targets: ['localhost:9100']  
EOF'

Start services and access the web console:

sudo systemctl daemon-reload
sudo systemctl start prometheus
sudo systemctl start node_exporter

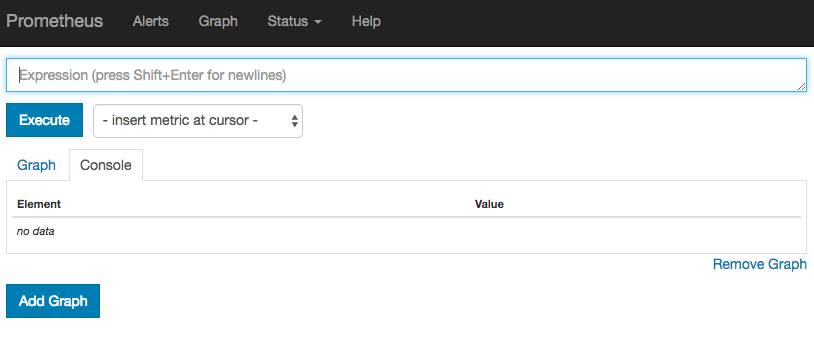
Access the Prometheus web console via http://localhost:9090:

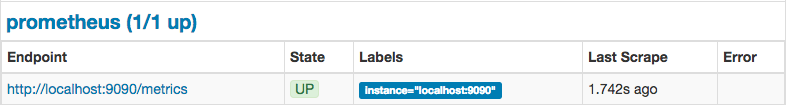
Under “Status -> Targets” you can check if the services state is up:

Let’s continue by installing Grafana:

curl https://packagecloud.io/gpg.key | sudo apt-key add -
sudo add-apt-repository "deb https://packagecloud.io/grafana/stable/debian/ stretch main"
sudo apt-get update
sudo apt-get install grafana
sudo systemctl start grafana-server
sudo systemctl status grafana-server
sudo systemctl enable grafana-server

Now you can access Grafana via http://localhost:3000/. I would recommend putting a Ngnix reverse proxy in-front for SSL encryption.

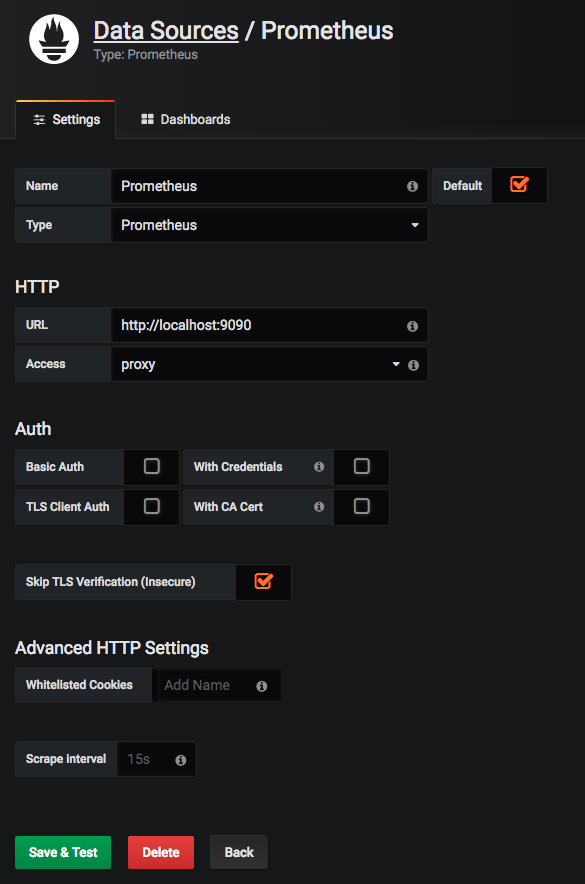
In the web console we need to configure the data source and point it to Prometheus. To do that go to “settings” and select “data source”:

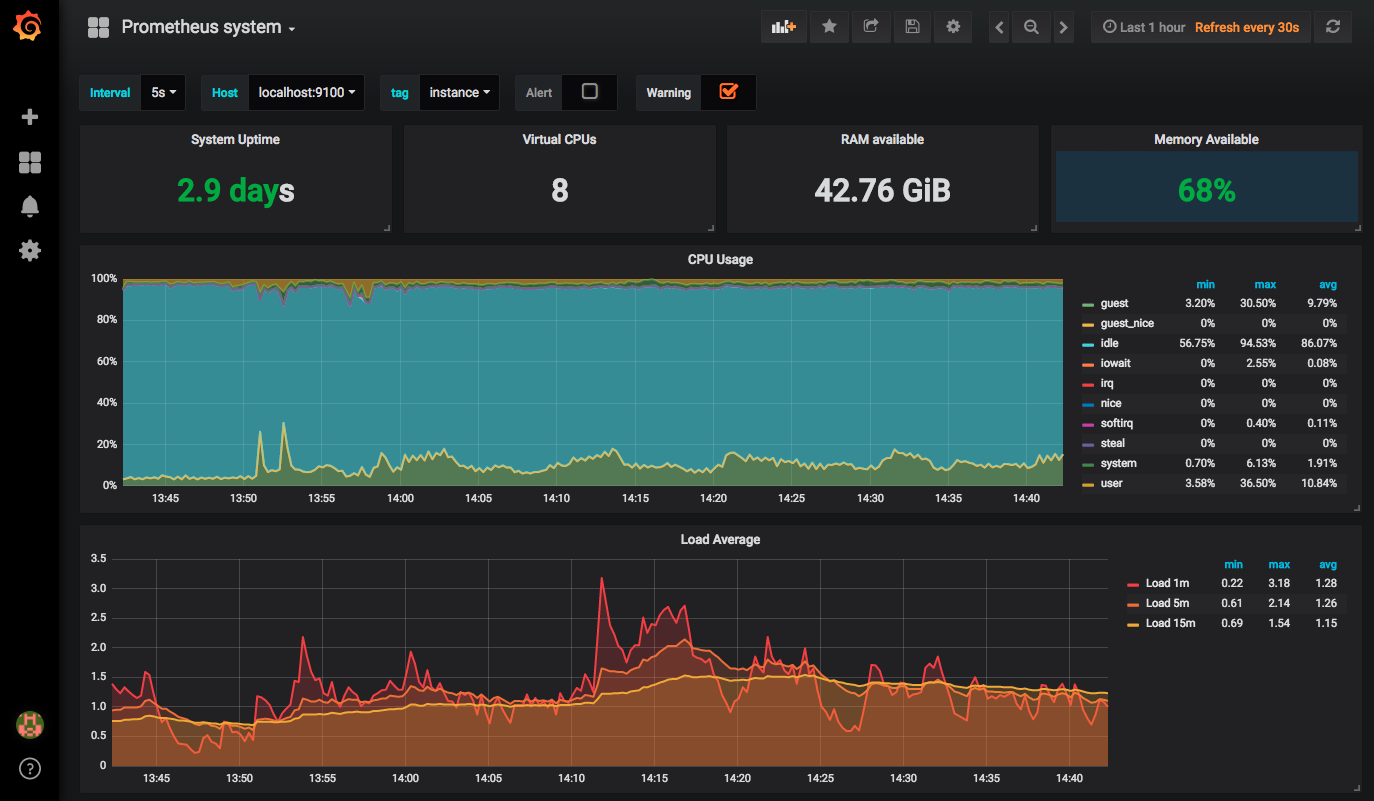
You should import the following Prometheus dashboard for Grafana otherwise you need to manually configure your dashboard:

For the install of Prometheus and the Node_Exporter I will write two Ansible roles which I will share later. Read my new post about Network Monitoring with Prometheus and Cumulus Linux!

Please share your feedback and leave a comment.

Quality of Service with Cisco ASA

Bin some years since I was working with Cisco ASA and QoS. I am into Cisco ASA performance optimising and tuning, it`s lots of fun to play around with different settings and get as much performance out of the ASA.

The ASA supports the following QoS features:

  • Priority queuing – To prioritize the packets that need prioritization like Voice over IP which is sensitive to latency. The ASA can only support Low Latency Queueing (LLQ).
  • Policing – To prevent traffic to consum all the network bandwidth by one user or one application. The policies restrict the bandwidth and can be applied to inbound and outbound traffic to an interface. The options are either drop or permit when the traffic exeed the limits.
  • Traffic shaping – Traffic that exceed the configured limits will be queued and sent when the traffic goes below the threshold. Traffic shaping will not drop packets that go over the threshold what is better for application which are sensitive to packet loss. Can be only applied to outgoing traffic on a physical interface and traffic shaping on ASA 5500-X models it is not supported.

Some information you need to keep in mind if you configure QoS on a Cisco ASA:

  • Supported in single context mode only. Does not support multiple context mode. Very sad because I prefer using virtual security contexts on ASAs.
  • QoS features can be only applied to physical interfaces (port-channel are not supported)
  • The ASA does not locally mark/remark any classified traffic.

See the following supported feature combinations per interface:

  • Standard priority queuing (for specific traffic) + Policing (for the rest of the traffic).
  • Traffic shaping (for all traffic on an interface) + Hierarchical priority queuing (for a subset of traffic).

In my case I have a Cisco ASA 5515-X and will do standard priority queuing and policing for the rest of the traffic.

Please always read the Cisco ASA Configuration Guide to ensure that your configuration is correct and supported!

::::::::::::::::::::::::::::::::::::::::::::::::::::::::::::::
:: Quality of Service Configuration                         ::
::::::::::::::::::::::::::::::::::::::::::::::::::::::::::::::

::::::::::::::::::::::::::::::::::::::::::::::::::::::::::::::
:: Class of Service	DSCP Marking (codepoint name)	    ::
:: Premium	        46 (EF)		                    ::
:: Business-1		26 (AF31)			    ::
:: Business-2		18 (AF21)		            ::
:: Standard		0				    ::
:: Management		34 (AF41)			    ::
:: Routing Protocol	48 (IP-Precedence 6)		    ::
::::::::::::::::::::::::::::::::::::::::::::::::::::::::::::::   

class-map premium-qos-traffic
	match dscp 46
	exit

class-map business-1-qos-traffic
	match dscp 26
	exit

class-map business-2-qos-traffic
	match dscp 18
	exit		

policy-map transfer-uk-mpls_policy

	class premium-qos-traffic
		priority 
		exit

	class business-1-qos-traffic
		police output 8388500 conform-action transmit exceed-action transmit
		exit

	class business-2-qos-traffic
	 	police output 10485760 655360 conform-action transmit exceed-action drop
	 	exit

	class class-default
		police output 2097000 655360 conform-action transmit exceed-action drop
		exit

priority-queue transfer-uk-mpls
	exit

service-policy transfer-uk-mpls_policy interface transfer-uk-mpls

Optimizing Cisco ASA Firewall Configuration

From my experience with Cisco ASAs over the last years it can make a big difference on the performance if the ASA is not correctly configured. You have to keep some things in mind when you install and set-up your firewalls. Of course for low traffic networks it will not make a big difference but for data centre infrastructures it can make a huge difference on the load of your CPU.

In the end from the network perspective everything can influence the performance: throughput (bit/s, packets/s and packet size), sessions (new and max connections), inspection and encryption (VPN). I recommend to have a look at the CiscoLive 365 presentation from 2012 – Maximizing Firewall Performance, very interesting presentation about the ASA hardware platform’s and what influence the performance.

At first some general information about the ASA platform’s before you start configuring

ASA5510 to 5550

  • On-board interfaces are better for higher packet rate

ASA5580

  • Traffic distribution over both I/O bridges
  • Keep flows on same I/O bridge and place interface pairs on the same card (inside and outside)

ASA55xx-X

  • Possible to use jumbo frames but only make sense in end-to-end configuration

All ASA platform’s

  • Use port-channel for 1Gbit interfaces to split frames over multiple FIFO queues and RX rings (10Gbit interface have four RX rings)
  • Avoid inter-context traffic because it uses the loopback buffer

SNMP and Logging settings

Disable SNMP traps if not needed and use polling only

snmp-server host INSIDE 10.255.0.10 poll community public version 2c

Only use one syslog server and proper trap level to reduce CPU overhead also adjust the ASDM logging

logging enable

logging host INSIDE 10.255.0.10
logging trap critical
logging history errors
logging queue 2048 

logging asdm warning 
logging asdm-buffer-size 512 

asdm history enable

Filter logging messages to reduce CPU overhead and prevent misconfigured debug logging to overload the CPU of the firewall

:: Build TCP Connection
no logging message 302013

:: Teardown TCP Connection
no logging message 302014

:: Deny udp reverse path check
no logging message 106021

:: Bad TCP hdr length
no logging message 500003

:: Denied ICMP type=0, no matching session
no logging message 313004

:: No matching connection for ICMP error message
no logging message 313005

:: Inbound TCP connection denied outside Firewall Access
no logging message 106001

:: Inbount UDP connection denied outside Firewall Access
no logging message 106006
no logging message 106007

Disable Threat Detection statistics

threat-detection basic-threat
no threat-detection statistics

Enable threat detection statistics only temporary because it can have a big impact on the performance of your ASA but keep basic threat detection always enabled!

ICMP interface settings

Not really related to optimizing the performance but ICMP should be correctly configured

icmp unreachable rate-limit 1 burst-size 1

icmp permit any echo OUTSIDE
icmp permit any echo-reply OUTSIDE
icmp permit any unreachable OUTSIDE

icmp permit any echo INSIDE
icmp permit any echo-reply INSIDE
icmp permit any unreachable INSIDE

Transport Protocol settings

Adjust default TCP MMS (Maximum Segment Size) 1380 to higher value (Please be careful sometimes it makes sense to leave it at 1380).

sysopt connection tcpmss 1460
sysopt connection tcpmss minimum 0

ASA silently drop packets without sending TCP reset.

no service resetinbound
no service resetoutside

Timeout value settings

Change timeout values for XLATE table, TCP/UDP sessions and Firewall Engine settings

timeout xlate 1:05:00
timeout udp 00:01:00
timeout conn 01:00:00
timeout half-closed 00:10:00
timeout h323 00:00:01
timeout sunrpc 00:01:00
timeout sip 00:05:00
timeout sip_media 00:01:00
timeout h225 00:00:01
timeout mgcp 00:00:01
timeout uauth 00:00:01 absolute

Antispoofing Options

ip verify reverse-path interface OUTSIDE
ip verify reverse-path interface INSIDE

Modular Policy Framework (MPF)

Modular Policy Framework provides a consistent and flexible way to configure security appliance features. For example, you can use Modular Policy Framework to create a timeout configuration that is specific to a particular TCP application, as opposed to one that applies to all TCP applications.
ACL and Class-Map for unrestricted IP traffic between backend networks

access-list UNRESTRICTED-IP-TRAFFIC extended permit ip object NET_10.1.100.0 object NET_10.2.100.0
access-list UNRESTRICTED-IP-TRAFFIC extended permit ip object NET_10.1.200.0 object NET_10.2.200.0
access-list UNRESTRICTED-IP-TRAFFIC extended permit ip object NET_10.1.300.0 object NET_10.2.300.0

class-map unrestricted-ip-traffic
match access-list UNRESTRICTED-IP-TRAFFIC
exit

ACL and Class-Map for any IP traffic

access-list ALL-IP-TRAFFIC extended permit ip any any

class-map all-ip-traffic
match access-list ALL-IP-TRAFFIC
exit

Inspection Policy for DNS traffic

policy-map type inspect dns custom_dns_map
 parameters
  message-length maximum 1280
  dns-guard
  protocol-enforcement
  no nat-rewrite
  no id-randomization
  no tsig enforced
  no id-mismatch
  exit
 exit

Policy Map

Turn off not needed inspection to reduce processing overhead within the CPU. In the policy map you define the TCP connection quotas for the before configured class-map’s ACLs.

policy-map global_policy

  class inspection_default
   inspect icmp
   inspect icmp error
   inspect ftp
   inspect dns custom_dns_map

   no inspect rtsp
   no inspect pptp
   no inspect sip
   no inspect ctiqbe
   no inspect esmtp
   no inspect gtp
   no inspect h323
   no inspect h323 ras
   no inspect h323 h225
   no inspect http
   no inspect ils
   no inspect mgcp
   no inspect netbios
   no inspect rsh
   no inspect skinny
   no inspect snmp
   no inspect sqlnet
   no inspect sunrpc
   no inspect tftp
   no inspect xdmcp
   exit

  class unrestricted-ip-traffic
   set connection advanced-options tcp-state-bypass
   set connection per-client-max 0
   set connection conn-max 0
   set connection timeout embryonic 0:00:10
   set connection timeout half-closed 0:10:00
   set connection timeout tcp 1:00:00
   exit

  class all-ip-traffic
   set connection random-sequence-number enable
   set connection per-client-max 500
   set connection conn-max 0
   set connection embryonic-conn-max 100
   set connection per-client-embryonic-max 50
   set connection timeout embryonic 0:00:10
   set connection timeout half-closed 0:10:00
   set connection timeout tcp 1:00:00
   exit
exit

Additional information

There are also some more points to think about what can influense the performance of the ASA firewall.

  • Several smaller ACLs are better than a large one (ACL size mostly impacts conn setup rate)
  • Static NAT entries are best for higher performance
  • Optimize dynamic routing because it has an impact on the CPU
  • Careful with inline packet capturing
  • Keep HTTP conn replication disabled for best performance results
  • Share the load with active virtual contexts on each firewall, see here my post: Cisco ASA Virtual Context Mode