I had a first look at OpenShift 4.0 and I wanted to share some information from what I have seen so far. The installation of the cluster is super easy and RedHat did a lot to improve the overall experience of the installation process to the previous OpenShift v3.x Ansible based installation and moving towards ephemeral cluster deployments.
There are a many changes under the hood and it’s not as obvious as Bootkube for the self-hosted/healing control-plane, MachineSets and the many internal operators to install and manage the OpenShift components ( api server, scheduler, controller manager, cluster-autoscaler, cluster-monitoring, web-console, dns, ingress, networking, node-tuning, and authentication ).
For the OpenShift 4.0 developer preview you need an RedHat account because you require a pull-secret for the cluster installation. For more information please visit: https://cloud.openshift.com/clusters/install
First we need to download the openshift-installer binary:
wget https://github.com/openshift/installer/releases/download/v0.16.1/openshift-install-linux-amd64
mv openshift-install-linux-amd64 openshift-install
chmod +x openshift-install
Then we create the install-configuration, it is required that you already have AWS account credentials and an Route53 DNS domain set-up:
$ ./openshift-install create install-config
INFO Platform aws
INFO AWS Access Key ID *********
INFO AWS Secret Access Key [? for help] *********
INFO Writing AWS credentials to "/home/centos/.aws/credentials" (https://docs.aws.amazon.com/cli/latest/userguide/cli-configure-files.html)
INFO Region eu-west-1
INFO Base Domain paas.domain.com
INFO Cluster Name cluster1
INFO Pull Secret [? for help] *********
Let’s look at the install-config.yaml
apiVersion: v1beta4
baseDomain: paas.domain.com
compute:
- name: worker
  platform: {}
  replicas: 3
controlPlane:
  name: master
  platform: {}
  replicas: 3
metadata:
  creationTimestamp: null
  name: ew1
networking:
  clusterNetwork:
  - cidr: 10.128.0.0/14
    hostPrefix: 23
  machineCIDR: 10.0.0.0/16
  networkType: OpenShiftSDN
  serviceNetwork:
  - 172.30.0.0/16
platform:
  aws:
    region: eu-west-1
pullSecret: '{"auths":{...}'
Now we can continue to create the OpenShift v4 cluster which takes around 30mins to complete. At the end of the openshift-installer you see the auto-generate credentials to connect to the cluster:
$ ./openshift-install create cluster
INFO Consuming "Install Config" from target directory
INFO Creating infrastructure resources...
INFO Waiting up to 30m0s for the Kubernetes API at https://api.cluster1.paas.domain.com:6443...
INFO API v1.12.4+0ba401e up
INFO Waiting up to 30m0s for the bootstrap-complete event...
INFO Destroying the bootstrap resources...
INFO Waiting up to 30m0s for the cluster at https://api.cluster1.paas.domain.com:6443 to initialize...
INFO Waiting up to 10m0s for the openshift-console route to be created...
INFO Install complete!
INFO Run 'export KUBECONFIG=/home/centos/auth/kubeconfig' to manage the cluster with 'oc', the OpenShift CLI.
INFO The cluster is ready when 'oc login -u kubeadmin -p jMTSJ-F6KYy-mVVZ4-QVNPP' succeeds (wait a few minutes).
INFO Access the OpenShift web-console here: https://console-openshift-console.apps.cluster1.paas.domain.com
INFO Login to the console with user: kubeadmin, password: jMTSJ-F6KYy-mVVZ4-QVNPP
The web-console has a very clean new design which I really like in addition to all the great improvements.
Under administration -> cluster settings you can explore the new auto-upgrade functionality of OpenShift 4.0:
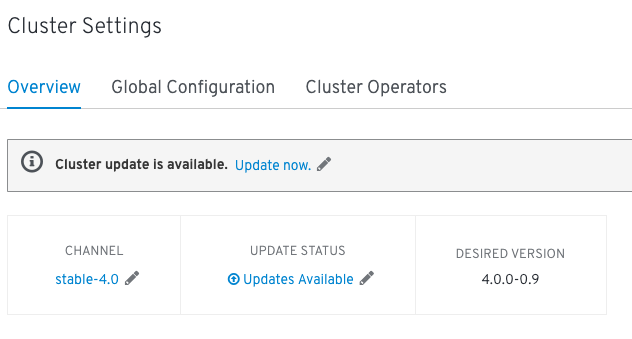
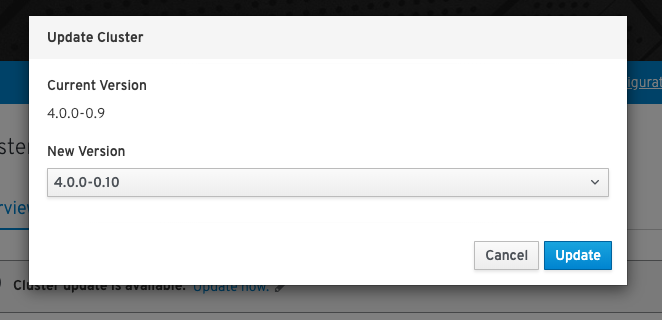
You choose the new version to upgrade and everything else happens in the background which is a massive improvement to OpenShift v3.x where you had to run the ansible installer for this.
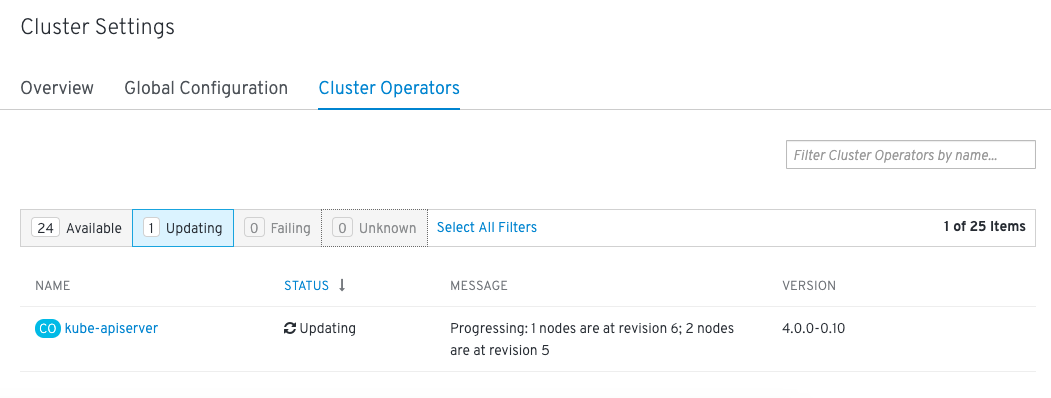
In the background the cluster operator upgrades the different platform components one by one.
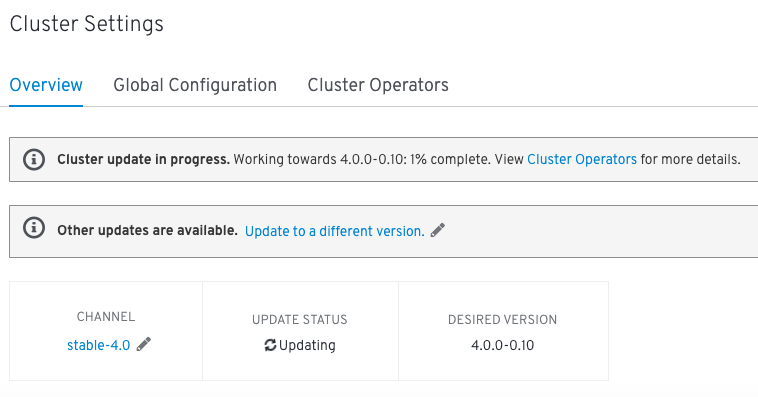
Slowly you will see that the components move to the new build version.
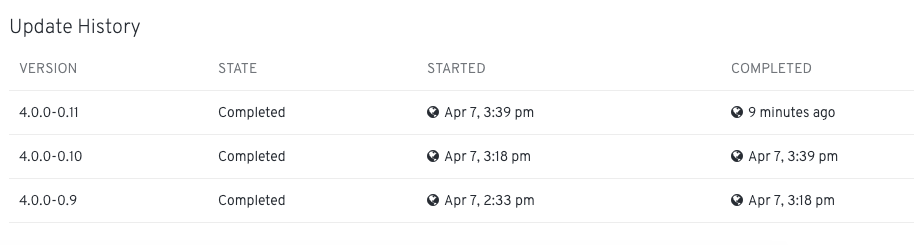
Finished cluster upgrade:
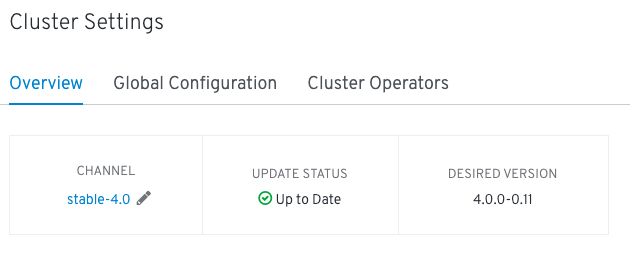
You can only upgrade from one version 4.0.0-0.9 to the next version 4.0.0-0.10. It is not possible to upgrade and go straight from x-0.9 to x-0.11.
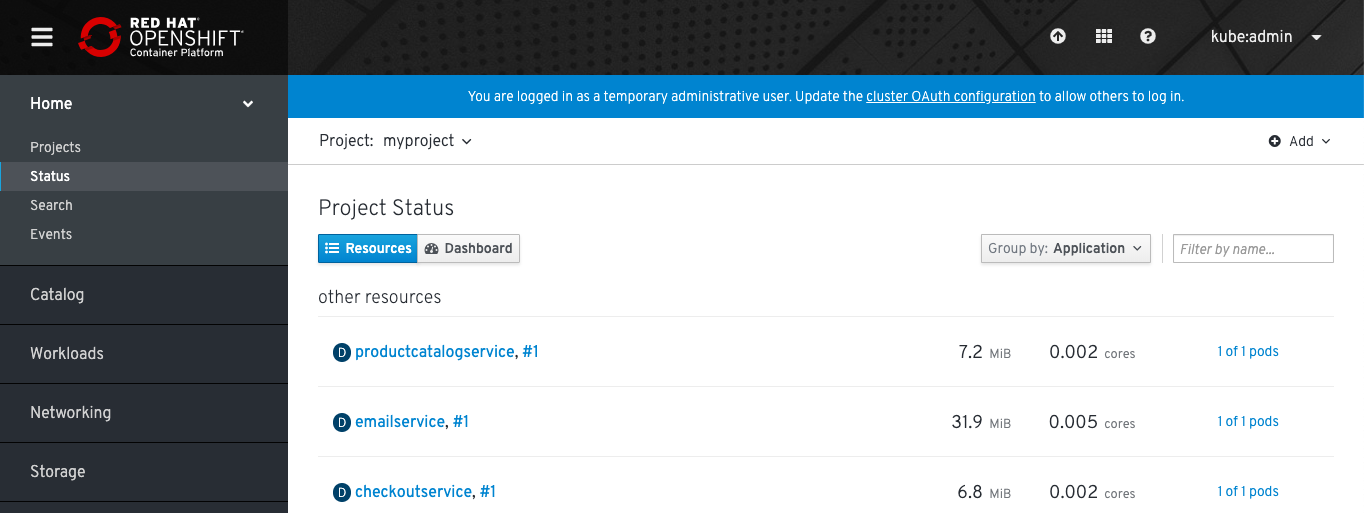
But let’s deploy the Google Hipster Shop example and expose the frontend-external service for some more testing:
oc login -u kubeadmin -p jMTSJ-F6KYy-mVVZ4-QVNPP https://api.cluster1.paas.domain.com:6443 --insecure-skip-tls-verify=true
oc new-project myproject
oc create -f https://raw.githubusercontent.com/berndonline/openshift-ansible/master/examples/hipster-shop.yml
oc expose svc frontend-external
Getting the hostname for the exposed service:
$ oc get route
NAME                HOST/PORT                                                   PATH      SERVICES            PORT      TERMINATION   WILDCARD
frontend-external   frontend-external-myproject.apps.cluster1.paas.domain.com             frontend-external   http                    None
Use the browser to connect to our Hipster Shop:

It’s also very easy to destroy the cluster as it is to create it, as you seen previously:
$ ./openshift-install destroy cluster
INFO Disassociated                                 arn="arn:aws:ec2:eu-west-1:552276840222:route-table/rtb-083e2da5d1183efa7" id=rtbassoc-01d27db162fa45402
INFO Disassociated                                 arn="arn:aws:ec2:eu-west-1:552276840222:route-table/rtb-083e2da5d1183efa7" id=rtbassoc-057f593640067efc0
INFO Disassociated                                 arn="arn:aws:ec2:eu-west-1:552276840222:route-table/rtb-083e2da5d1183efa7" id=rtbassoc-05e821b451bead18f
INFO Disassociated                                 IAM instance profile="arn:aws:iam::552276840222:instance-profile/ocp4-bgx4c-worker-profile" arn="arn:aws:ec2:eu-west-1:552276840222:instance/i-0f64a911b1ffa3eff" id=i-0f64a911b1ffa3eff name=ocp4-bgx4c-worker-profile role=ocp4-bgx4c-worker-role
INFO Deleted                                       IAM instance profile="arn:aws:iam::552276840222:instance-profile/ocp4-bgx4c-worker-profile" arn="arn:aws:ec2:eu-west-1:552276840222:instance/i-0f64a911b1ffa3eff" id=i-0f64a911b1ffa3eff name=0xc00090f9a8
INFO Deleted                                       arn="arn:aws:ec2:eu-west-1:552276840222:instance/i-0f64a911b1ffa3eff" id=i-0f64a911b1ffa3eff
INFO Deleted                                       arn="arn:aws:ec2:eu-west-1:552276840222:instance/i-00b5eedc186ba26a7" id=i-00b5eedc186ba26a7
...
INFO Deleted                                       arn="arn:aws:ec2:eu-west-1:552276840222:security-group/sg-016d4c7d435a1c97f" id=sg-016d4c7d435a1c97f
INFO Deleted                                       arn="arn:aws:ec2:eu-west-1:552276840222:subnet/subnet-076348368858e9a82" id=subnet-076348368858e9a82
INFO Deleted                                       arn="arn:aws:ec2:eu-west-1:552276840222:vpc/vpc-00c611ae1b9b8e10a" id=vpc-00c611ae1b9b8e10a
INFO Deleted                                       arn="arn:aws:ec2:eu-west-1:552276840222:dhcp-options/dopt-0ce8b6a1c31e0ceac" id=dopt-0ce8b6a1c31e0ceac
The install experience is great for OpenShift 4.0 which makes it very easy for everyone to create and get started quickly with an enterprise container platform. From the operational perspective I still need to see how to run the new platform because all the operators are great and makes it an easy to use cluster but what happens when one of the operators goes rogue and debugging this I am most interested in.
Over the coming weeks I will look into more detail around OpenShift 4.0 and the different new features, I am especially interested in Service Mesh.