VMware NSX Edge Routing

I recently deployed VMware NSX (Software defined Network) in our datacentre.

About the NSX Edge cluster there are some some specific requirements when it comes to physical connectivity. All the information you find as well in the VMware NSX reference design guide.

On Cumulus Linux side I am using BGP in Quagga and the traffic is distributed via ECMP (Equal-cost multi-path) over multiple Edge nodes within NSX.

See below the overview:

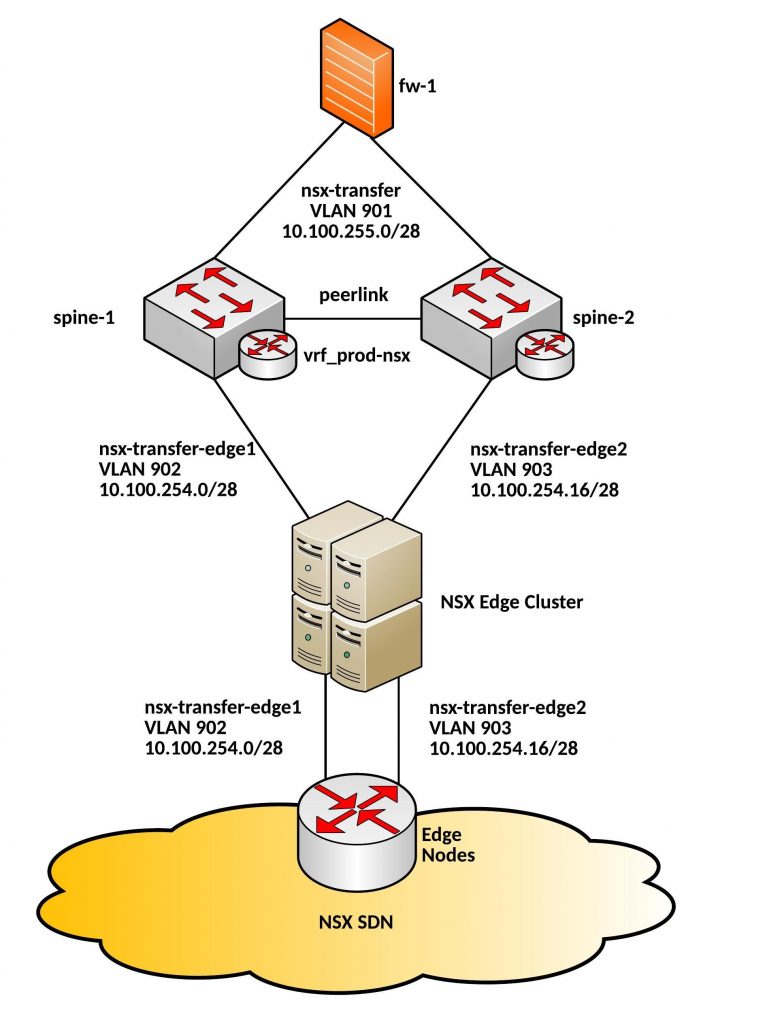
Very important to have an dedicated VLAN per core switch to the Edge Nodes. In my tests it didn’t work with a shared VLAN via the Cumulus core, the BGP neighbor relationships were correctly established but there was a problem with the packet forwarding via the Peerlink.

Here the example Quagga BGP config from spine-1:

router bgp 65001 vrf vrf-nsx
 neighbor 10.100.254.1 remote-as 65002
 neighbor 10.100.254.1 password verystrongpassword!!
 neighbor 10.100.254.1 timers 1 3
 neighbor 10.100.254.2 remote-as 65002
 neighbor 10.100.254.2 password verystrongpassword!!
 neighbor 10.100.254.2 timers 1 3
 neighbor 10.100.254.3 remote-as 65002
 neighbor 10.100.254.3 password verystrongpassword!!
 neighbor 10.100.254.3 timers 1 3
 neighbor 10.100.254.4 remote-as 65002
 neighbor 10.100.254.4 password verystrongpassword!!
 neighbor 10.100.254.4 timers 1 3
 neighbor 10.100.255.2 remote-as 65001
 neighbor 10.100.255.2 password verystrongpassword!!

 address-family ipv4 unicast
  network 0.0.0.0/0
  neighbor 10.100.254.1 route-map bgp-in in
  neighbor 10.100.254.2 route-map bgp-in in
  neighbor 10.100.254.3 route-map bgp-in in
  neighbor 10.100.254.4 route-map bgp-in in
  neighbor 10.100.255.2 next-hop-self
  neighbor 10.100.255.2 route-map bgp-in in
 exit-address-family

ip route 0.0.0.0/0 10.100.255.14 vrf vrf_prod-nsx

access-list bgp-in permit 10.100.0.0/17

route-map bgp-in permit 10
 match ip address bgp-in

The second core switch, spine-2 looks exactly the same only different IP addresses are used.

More about my experience with VMware NSX will follow soon.

Cisco Catalyst SPAN and Remote SPAN Configuration

To analyze network traffic passing through ports or VLANs you can configure SPAN or remote SPAN to mirror the traffic to another port on the switch or on another switch that has been connected to a network analyzer. The network analyzer can be Wireshark or Riverbed Cascade Pilot what capture or analyze the traffic. Cascade Pilot is here quite interesting because you can filter the traffic before and then send it to Wireshark for a deep analysis.

Back to the configuration, SPAN mirrors traffic received or sent (or both) on source ports or source VLANs to a destination port for analysis. The SPAN session does not affect the switching of network traffic on the source. Except for traffic on the destination, ports do not receive or forward traffic there are shown as monitoring interfaces.


Configure local SPAN session:

Define the source interface which traffic you want to mirror

monitor session 1 source interface GigabitEthernet 0/41

or VLAN as source

monitor session 1 source vlan 500

Define the destination interface

monitor session 1 destination interface GigabitEthernet 0/10


Configure remote SPAN session (1st switch):

At first create an remote SPAN VLAN

vlan 2010
  name RSPAN_VLAN
  remote-span
  exit

Then like the local SPAN session define the source

monitor session 1 source interface gi 0/47

or VLAN

monitor session 1 source vlan 500

At the end of the configuration of the 1st switch you configure the remote SPAN VLAN as destination

monitor session 1 destination remote vlan 2010


Configure remote SPAN session (2nd switch):

Like on the other switch you need to create at first an remote SPAN VLAN

vlan 2010
  name RSPAN_VLAN
  remote-span
  exit

Then as source you configure the RSPAN VLAN

monitor session 1 source remote vlan 2010

In the end the destination interface

monitor session 1 destination interface gi 0/18

Important is to verify that the RSPAN VLAN is allowed between these two switches on thier Trunk Interfaces!


With the following command you can verify the monitoring session you configured

show monitor session 1